


FXOpen

EUR/USD climbed above the 1.1150 resistance and it is currently correcting lower. Conversely, USD/JPY remained in a bearish zone and it could slide below 108.00.
Important Takeaways for EUR/USD and USD/JPY
- The Euro is currently correcting lower below the key 1.1150 support area.
- There was a break below a major bullish trend line with support near 1.1152 on the hourly chart of EUR/USD.
- USD/JPY is declining and is trading well below the 108.50 support area.
- There is a key bearish trend line forming with resistance near 108.65 on the hourly chart.
EUR/USD Technical Analysis
The Euro started a fresh increase after it broke the 1.1080 and 1.1100 resistance levels against the US Dollar. The EUR/USD pair even settled above the 1.1100 level to move into a positive zone.
It opened the doors for more gains above 1.1150 and the pair settled above the 50 hourly simple moving average. Finally, the pair traded as high as 1.1179 on FXOpen. It is currently correcting lower below the 1.1160 and 1.1150 support levels.
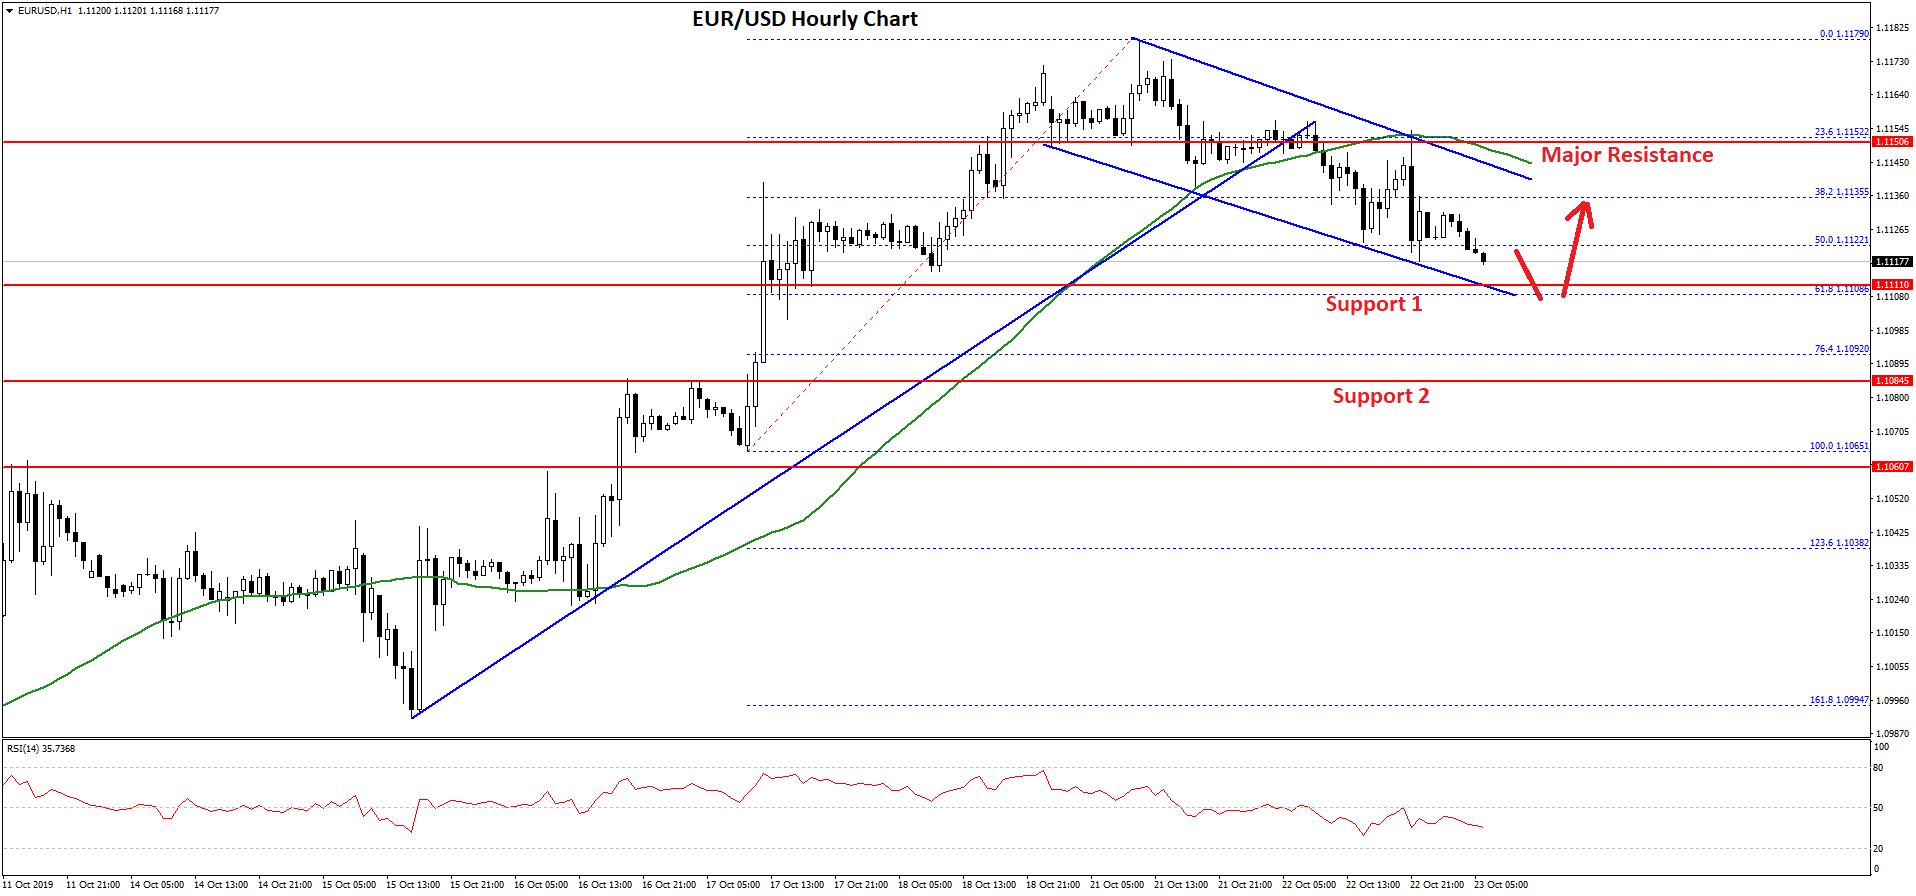
Moreover, there was a break below a major bullish trend line with support near 1.1152 on the hourly chart of EUR/USD. The pair is now trading well below the 1.1140 level and the 50 hourly SMA.
At the outset, the pair is trading just below the 50% Fib retracement level of the upward move from the 1.1065 low to 1.1179 high. An immediate support on the downside is near the 1.1110 level.
Besides, the 61.8% Fib retracement level of the upward move from the 1.1065 low to 1.1179 high might act as a support near the 1.118 level. If there are more downsides, EUR/USD could decline towards the 1.1080 support area.
On the upside, the previous supports near 1.1140 and 1.1150 are likely to act as strong resistances. To start a fresh increase towards 1.1180 and 1.1200, the pair must break 1.1150 and settle above the 50 hourly SMA.
USD/JPY Technical Analysis
The US Dollar struggled on many occasions to clear the 108.80 and 109.00 resistance levels against the Japanese Yen. As a result, the USD/JPY pair started a slow and steady decrease below the 108.50 support area.
Moreover, there was a close below the 108.50 support and the 50 hourly simple moving average. The pair even traded below the 76.4% Fib retracement level of the upward move from the 108.29 low to 108.72 high.
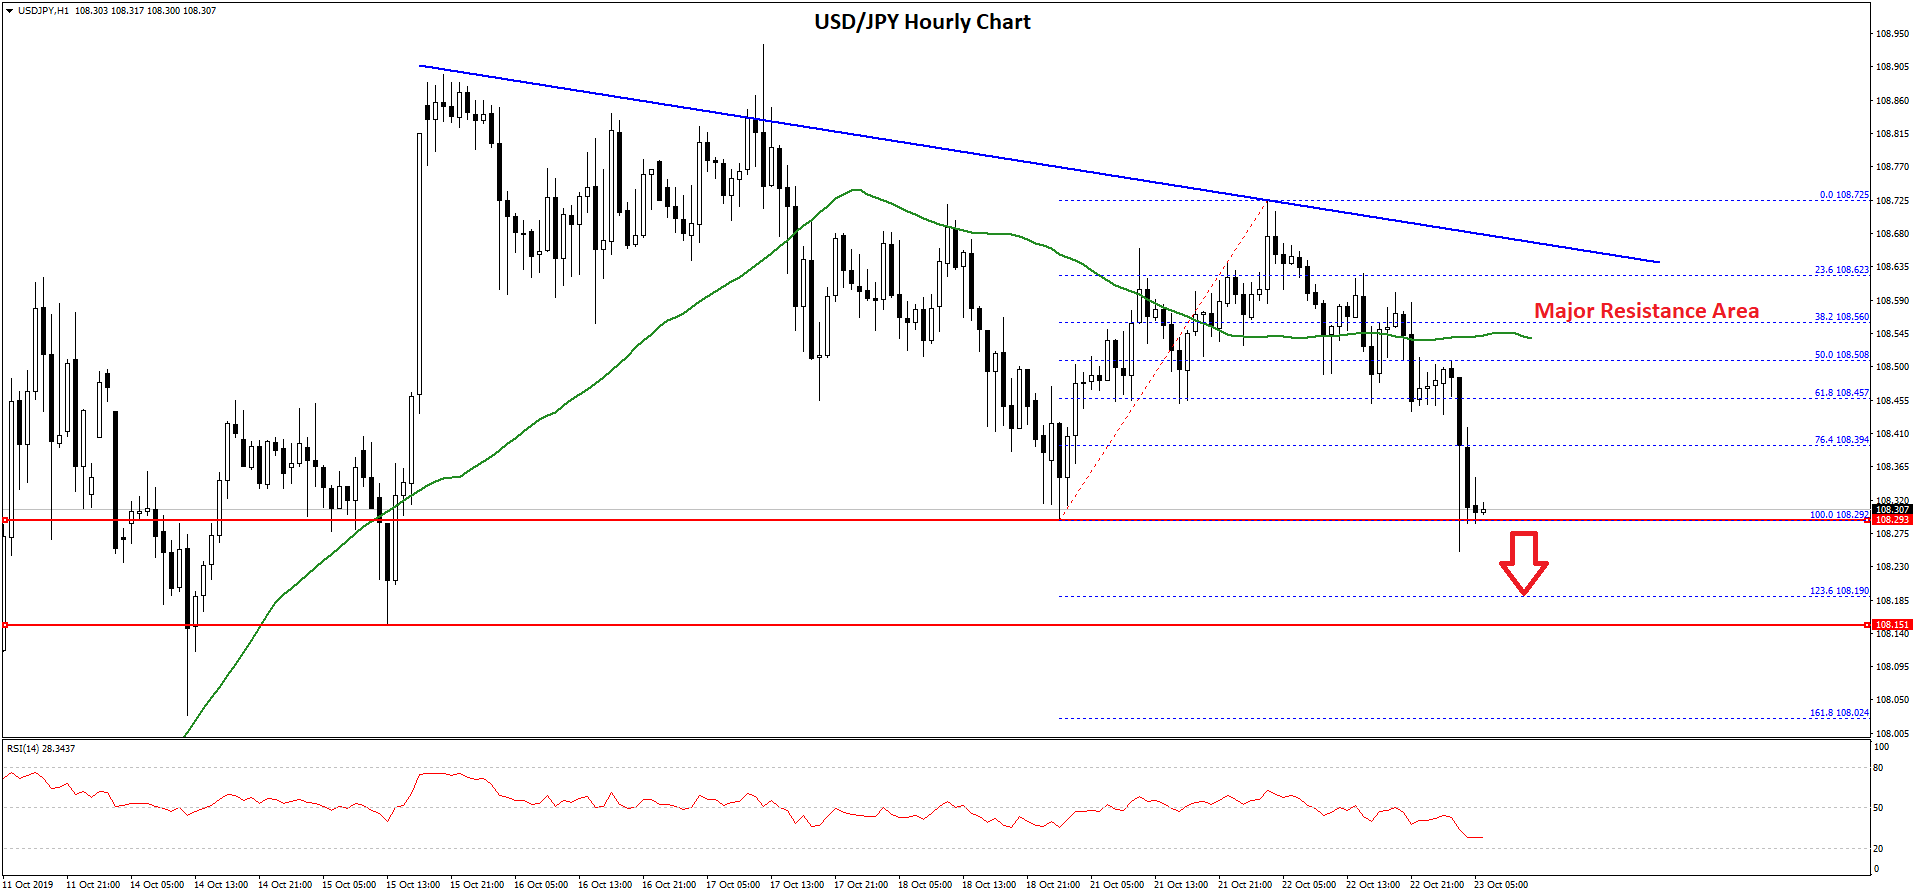
It is currently testing the 108.30 support area, with a bearish angle. If there is a downside break below 108.30, the pair could test the 108.20 level or the 1.236 Fib extension level of the upward move from the 108.29 low to 108.72 high.
Any further losses might trigger a strong decline towards the 108.00 and 107.80 support levels. On the upside, there are many hurdles for the bulls near the 108.50 level and the 50 hourly simple moving average.
Moreover, there is a key bearish trend line forming with resistance near 108.65 on the hourly chart. Therefore, the pair is likely to face a strong selling interest near the 108.50 and 108.60 levels.
To start a decent upward move, the pair must settle above 108.60 and the 50 hourly SMA. If not, it could resume its decline below 108.30 and 108.20.
Trade over 50 forex markets 24 hours a day with FXOpen. Take advantage of low commissions, deep liquidity, and spreads from 0.0 pips. Open your FXOpen account now or learn more about trading forex with FXOpen.
This article represents the opinion of the Companies operating under the FXOpen brand only. It is not to be construed as an offer, solicitation, or recommendation with respect to products and services provided by the Companies operating under the FXOpen brand, nor is it to be considered financial advice.
Latest from Forex Analysis
Latest articles

Anchored VWAP and How You Can Use It in Forex Trading
In the world of forex trading, understanding the nuanced tools at your disposal can significantly enhance decision-making processes. One such sophisticated tool is the Anchored Volume-Weighted Average Price (Anchored VWAP), which refines the standard VWAP by allowing traders to set

META Share Price Collapses after Publication of Quarterly Report
Just yesterday, META's stock price closed at USD 493.50, up approximately 40% since the start of 2024 and up nearly 300% since the start of 2023.
However, following the release of Meta's quarterly report, its shares plummeted to USD

USD/JPY Analysis: The Rate Exceeds The Level of 155 Yen Per US Dollar
Today, the price of USD/JPY once again renewed its 34-year high, exceeding the level of 155 yen per dollar, which put pressure on the current authorities.
According to Reuters, officials are trying to maintain calm in the market.
"We