


FXOpen
EUR/USD declined heavily recently and tested the 1.1335 zone. USD/CHF remained in a solid uptrend, but it is struggling to break the 0.9985-0.9990 resistance area.
Important Takeaways for EUR/USD and USD/CHF
- The Euro declined below the 1.1400 and 1.1360 support levels against the US Dollar.
- There is a major contracting triangle formed with resistance near 1.1370 on the hourly chart of EUR/USD.
- USD/CHF climbed higher sharply and traded towards the key 1.0000 resistance zone.
- There is a crucial bullish trend line formed with support at 0.9970 on the hourly chart.
EUR/USD Technical Analysis
The Euro started a major decline from well above the 1.1500 resistance area against the US Dollar. The EUR/USD pair declined below the 1.1480, 1.1440, 1.1400 and 1.1380 support levels.
The decline was such that the pair even settled below 1.1400 and the 50 hourly simple moving average. A new weekly low was formed at 1.1335 on FXOpen before the pair started an upside correction.
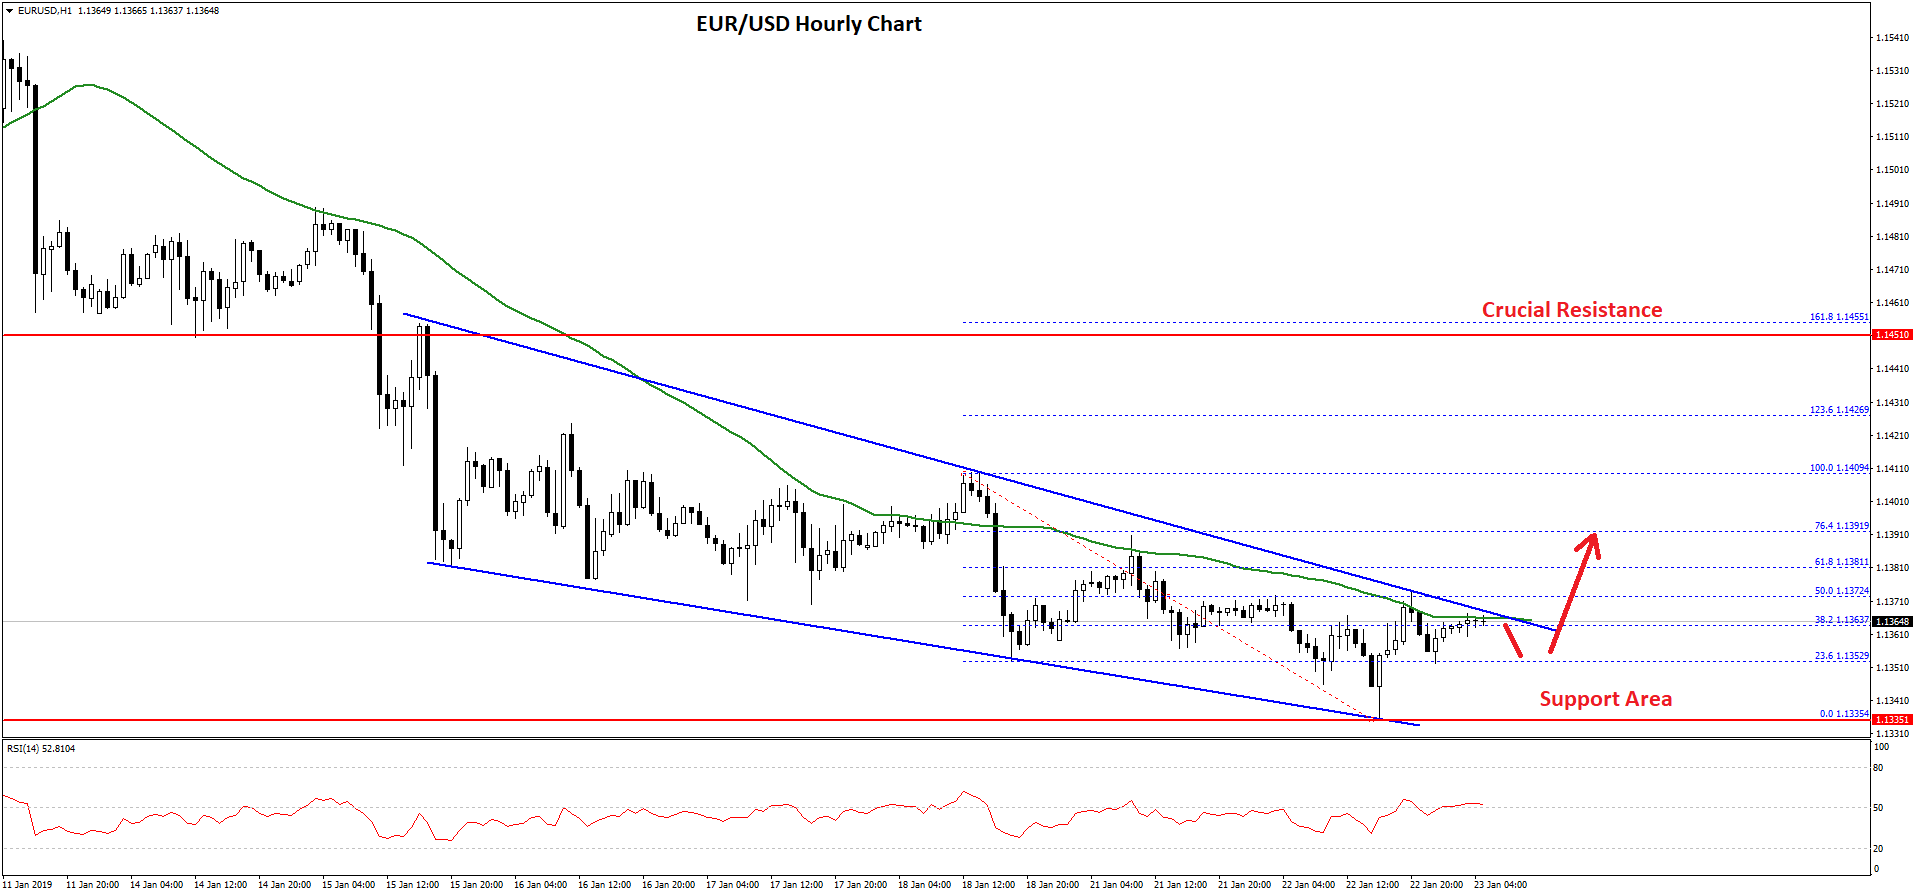
It moved above the 1.1350 level and the 23.6% Fib retracement level of the last decline from the 1.1409 high to 1.1335 low. However, the upside move was capped by the 1.1370-1.1380 resistance area and the 50 hourly SMA.
Moreover, there was a failure near the 50% Fib retracement level of the last decline from the 1.1409 high to 1.1335 low. Besides, there is a major contracting triangle formed with resistance near 1.1370 on the hourly chart of EUR/USD.
At the moment, it seems like the pair is about to break the triangle resistance, 1.1380, and the 50 hourly simple moving average. A successful close could open the doors for a short term correction towards the 1.1400 and 1.1415 resistance levels.
On the other hand, if the pair fails to move past 1.1380 and 1.1400, it may perhaps resume its decline towards the 1.1340 and 1.1310 support levels in the near term.
USD/CHF Technical Analysis
The US Dollar gained a lot of bullish momentum recently above the 0.9900 resistance level against the Swiss franc. The USD/CHF pair traded above the 0.9940 and 0.9950 resistance levels to move into a positive zone.
The recent uptrend was solid as the pair settled above the 0.9960 level and the 50 hourly simple moving average. The pair close to the 1.0000 barrier and a high was formed at 0.9987. Later, the pair started a downside correction and traded below the 0.9980 level.
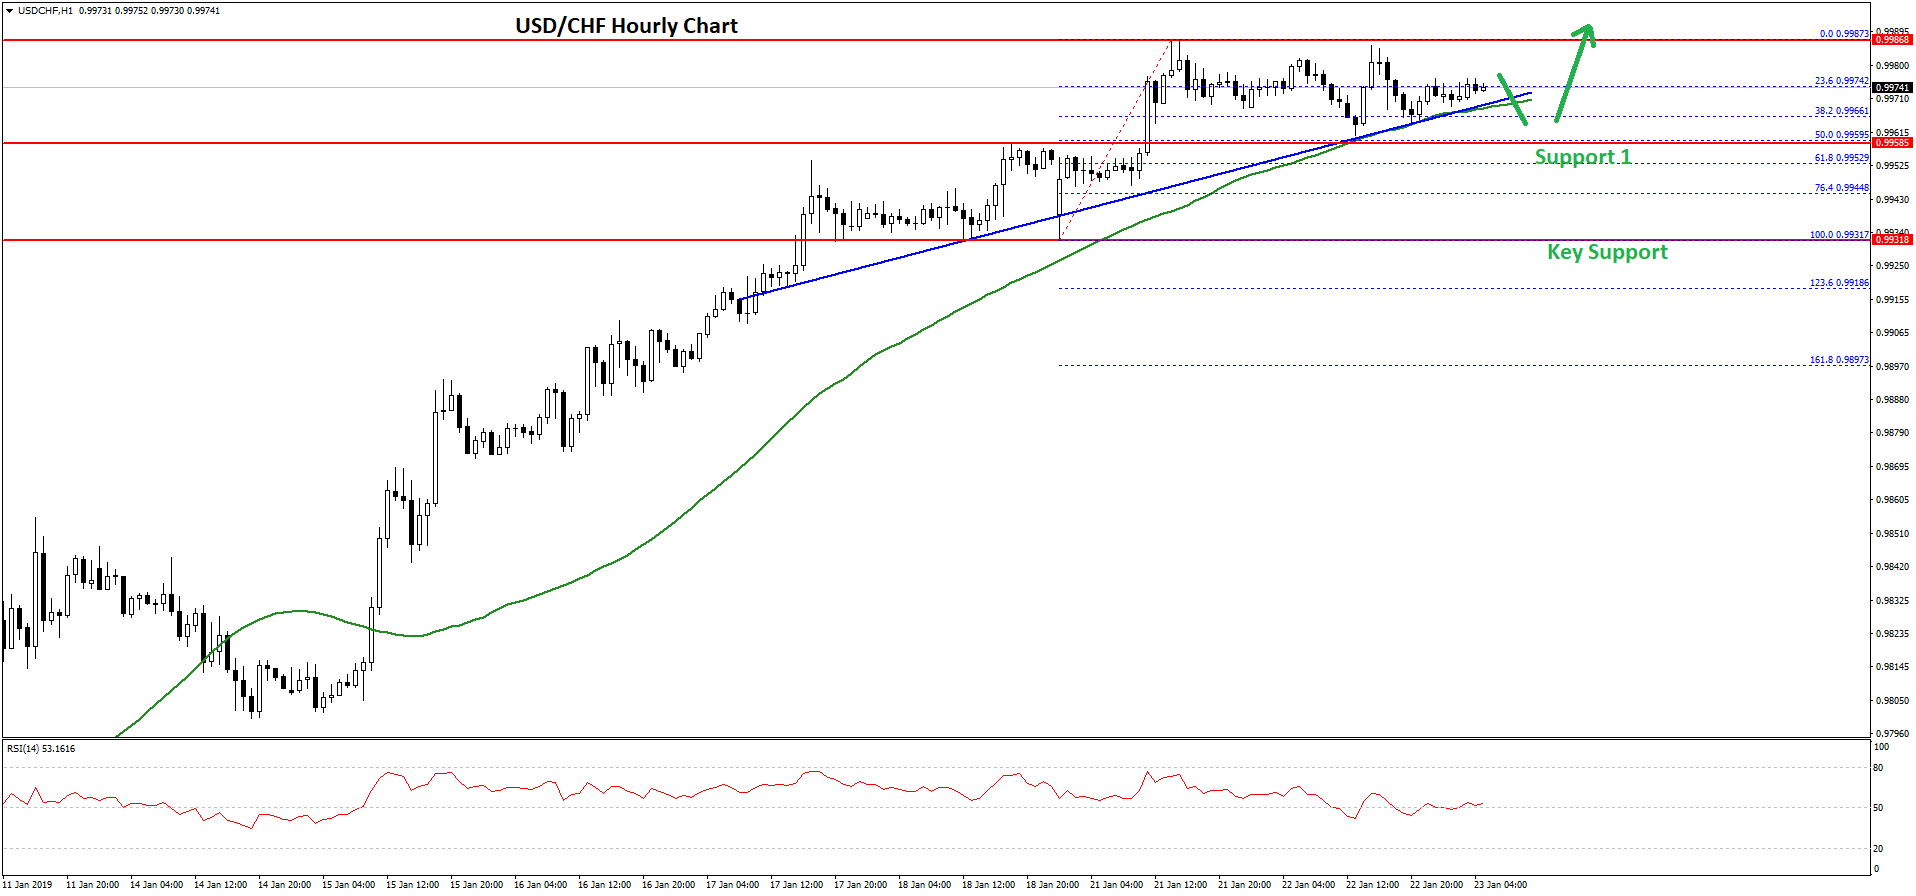
It broke the 23.6% Fib retracement level of the recent wave from the 0.9931 low to 0.9987 high. However, there are many supports on the downside near the 0.9960 and 0.9950 levels. Moreover, there is a crucial bullish trend line formed with support at 0.9970 on the hourly chart of USD/CHF.
Below the trend line support, the 50% Fib retracement level of the recent wave from the 0.9931 low to 0.9987 high is at 0.9955. Therefore, if the pair dips from the current levels, it could find a strong buying interest near the 0.9965, 0.9960, 0.9955 and 0.9950 levels.
On the upside, a break above the 0.9990 and 1.0000 levels may set the pace for more gains towards 1.0050 level in the coming sessions.
Trade over 50 forex markets 24 hours a day with FXOpen. Take advantage of low commissions, deep liquidity, and spreads from 0.0 pips. Open your FXOpen account now or learn more about trading forex with FXOpen.
This article represents the opinion of the Companies operating under the FXOpen brand only. It is not to be construed as an offer, solicitation, or recommendation with respect to products and services provided by the Companies operating under the FXOpen brand, nor is it to be considered financial advice.
Latest from Forex Analysis
Latest articles

Since the Start of the Week, Brent Oil Price Has Dropped over 4%
At the beginning of the week, March 15, we wrote that the price of Brent oil could form a correction from the resistance level of USD 91 per barrel. Since then, the price has decreased by more than 4% due

Fair Value Gaps vs Liquidity Voids in Trading
Understanding fair value gaps and liquidity voids is essential for traders seeking to navigate the complexities of the financial markets. These concepts, deeply rooted in the Smart Money Concept (SMC), provide valuable insights into the dynamics of supply and demand,

UK100 Share Index Rises as UK Inflation Slows
Yesterday, the UK Office for National Statistics (ONS) reported that the CPI stood at 3.2% in March. According to ForexFactory, analysts expected 3.1%, and a month ago the index was 3.4%.
Grant Fitzner, chief economist at the