


FXOpen

EUR/USD started a major decline and it traded below 1.1750. USD/JPY is rising and it even broke the 110.50 resistance zone.
Important Takeaways for EUR/USD and USD/JPY
- The Euro started a major decline below the 1.1800 and 1.1780 levels.
- There is a key bearish trend line forming with resistance near 1.1725 on the hourly chart of EUR/USD.
- USD/JPY started a fresh increase above the main 110.00 resistance zone.
- There is a major bullish trend line forming with support near 110.50 on the hourly chart.
EUR/USD Technical Analysis
After a failed attempt to clear 1.1850, the Euro started a major decline against the US Dollar. The EUR/USD pair broke the 1.1800 support zone to move into a bearish zone.
The pair settled below the 1.1800 level and the 50 hourly simple moving average. It even broke the 1.1750 support level and traded as low as 1.1709 on FXOpen. It is now consolidating gains above the 1.1700 support zone.
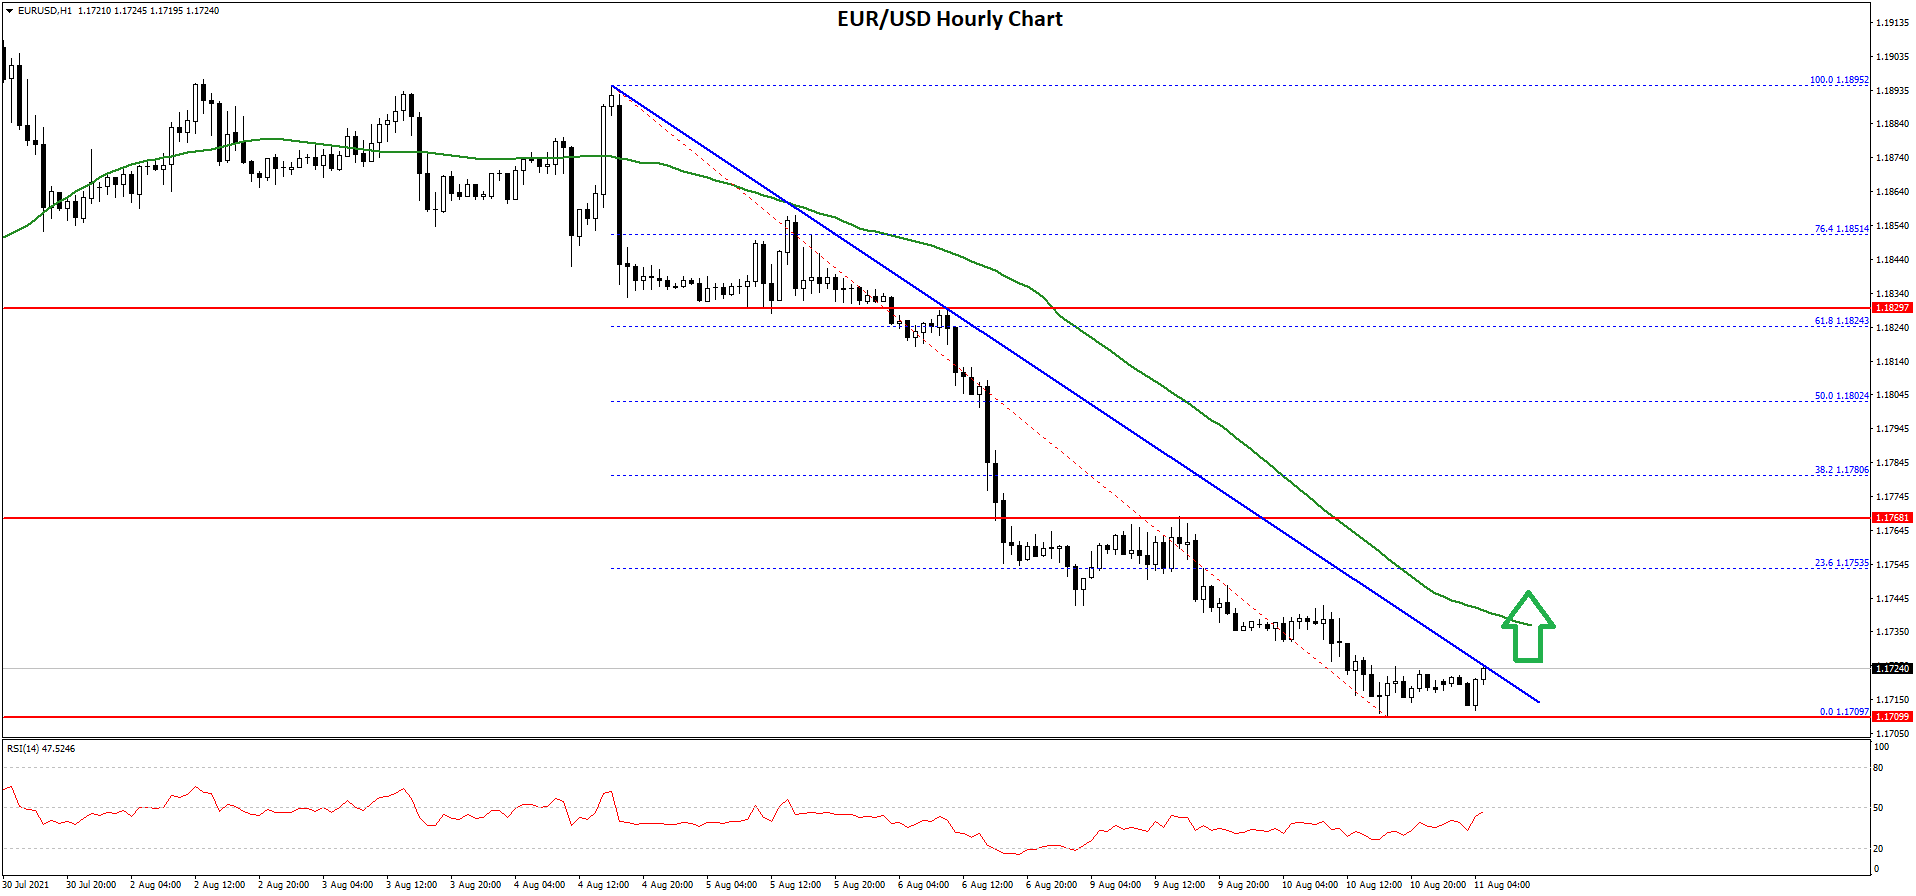
An immediate resistance is near the 1.1725 level. There is also a key bearish trend line forming with resistance near 1.1725 on the hourly chart of EUR/USD.
The first key resistance is near the 1.1750 level. It is near the 23.6% Fib retracement level of the recent decline from the 1.1895 swing high to 1.1709 low. Any more gains could start a decent increase towards the 1.1800 resistance.
The 50% Fib retracement level of the recent decline from the 1.1895 swing high to 1.1709 low is also near the 1.1800 level. A close above 1.1800 could open the doors for a steady increase towards 1.1850.
If not, the pair might continue to move down below 1.1710. An intermediate support is near the 1.1700 level. The next major support is near the 1.1680 level, below which the pair could drop towards the 1.1640 support in the near term.
USD/JPY Technical Analysis
The US Dollar started a fresh increase above the 109.50 resistance against the Japanese Yen. The USD/JPY pair broke the 109.80 and 110.00 resistance levels to move into a positive zone.
The pair even broke the 110.50 resistance and settled above the 50 hourly simple moving average. A high is formed near 110.68 and the pair is now consolidating gains. An initial support on the downside is near the 110.50 level.
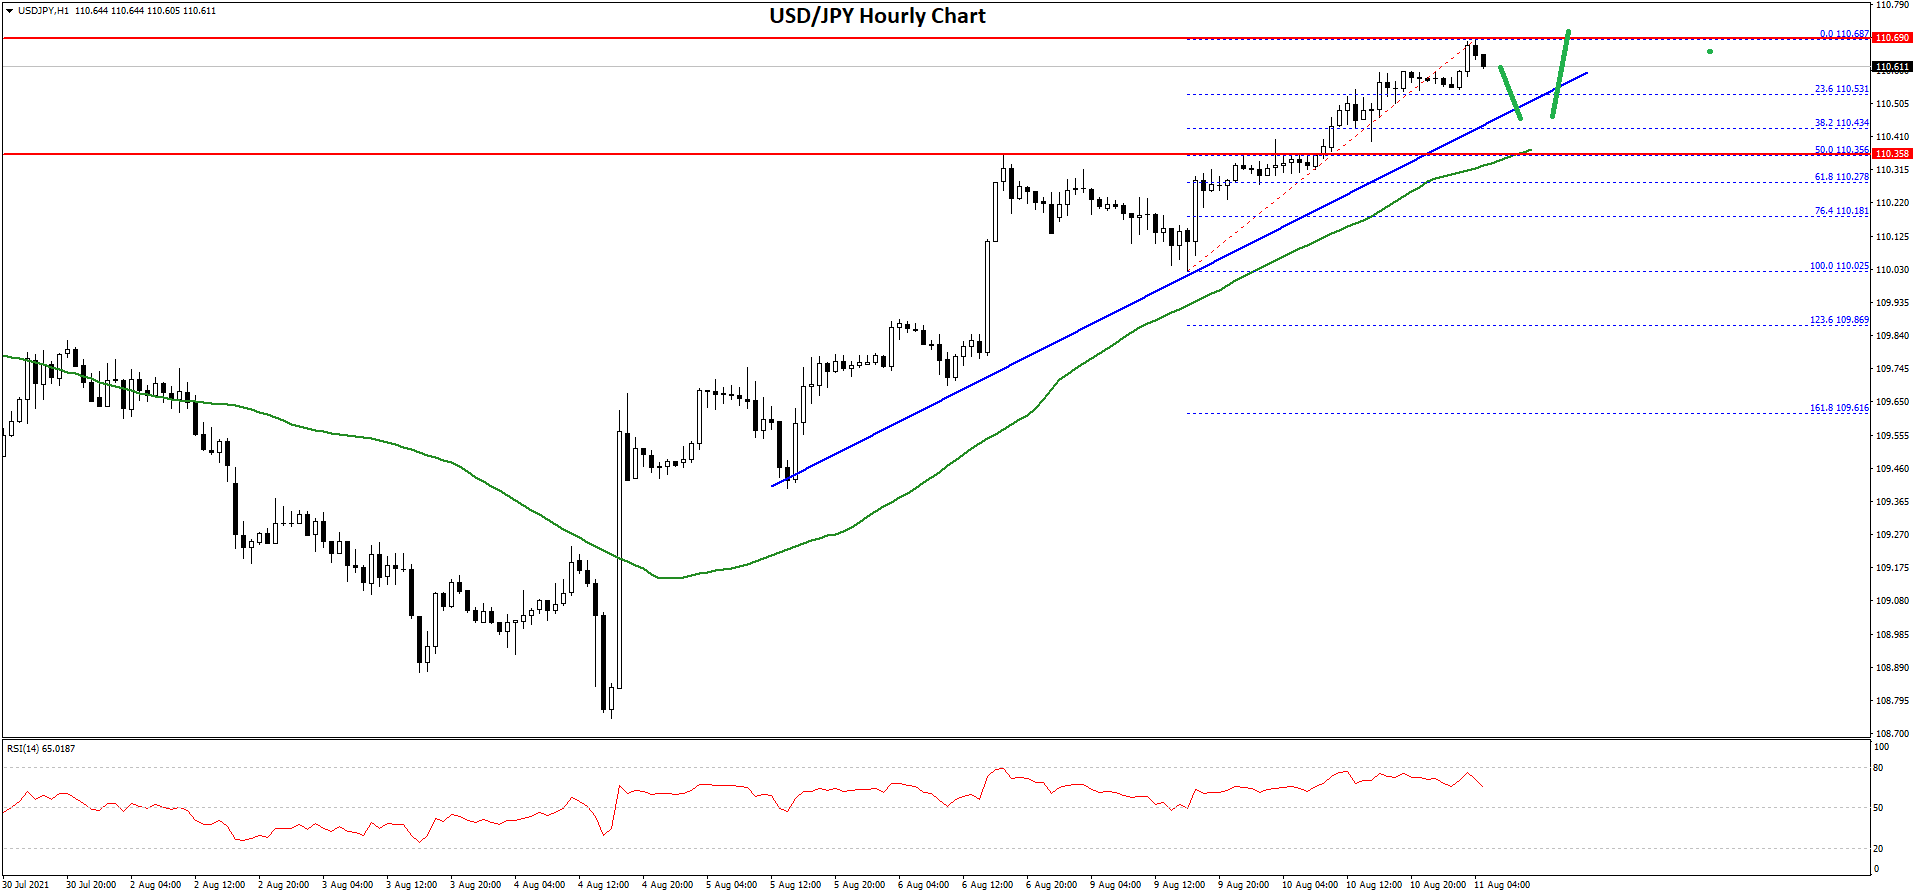
There is also a major bullish trend line forming with support near 110.50 on the hourly chart. The trend line is close to the 23.6% Fib retracement level of the upward move from the 110.02 swing low to 110.68 high.
If there is a downside break below the trend line, the pair could decline towards the 110.35 support and the 50 hourly SMA. The 50% Fib retracement level of the upward move from the 110.02 swing low to 110.68 high is also near 110.35.
Any more losses could open the doors for a move towards the 110.00 support zone. On the upside, an initial resistance is near the 110.65 level. The next major resistance is near the 110.80 level, above which the pair is likely to rise steadily in the coming sessions.
In the stated case, the pair could test 111.50. The next key resistance for the bulls could be near the 112.00 level in the near term.
This forecast represents FXOpen Markets Limited opinion only, it should not be construed as an offer, invitation or recommendation in respect to FXOpen Markets Limited products and services or as financial advice.
Trade over 50 forex markets 24 hours a day with FXOpen. Take advantage of low commissions, deep liquidity, and spreads from 0.0 pips. Open your FXOpen account now or learn more about trading forex with FXOpen.
This article represents the opinion of the Companies operating under the FXOpen brand only. It is not to be construed as an offer, solicitation, or recommendation with respect to products and services provided by the Companies operating under the FXOpen brand, nor is it to be considered financial advice.
Latest from Forex Analysis
Latest articles

AUD/USD Analysis: Aussie Weakens After RBA Decision
Following its decision on 7th May, the Reserve Bank of Australia (RBA) opted to maintain the interest rate at 4.35%, despite inflation continuing to decrease at a slower pace than anticipated by the RBA.
"I think we still think

The Hang Seng Index Has Risen by Over 13% in 2 Weeks
Analyzing the Hang Seng (Hong Kong 50 at FXOpen) chart, we wrote on January 30th that the price was near an important support level formed by the lower boundary (shown in orange) of a long-term channel, which has been relevant

Turtle Trading: System, Rules, and Strategy
In the 1980s, the Turtle Trading system was born from a debate about whether trading skills were innate or could be taught. Richard Dennis and William Eckhardt decided to train novices in their trend-following trading strategies, thus giving rise to