


FXOpen

EUR/USD is currently recovering and trading nicely above the 1.1050 support area. Conversely. USD/CHF is declining and it may continue to slide towards 0.9800
Important Takeaways for EUR/USD and USD/CHF
- The Euro is likely to continue higher above 1.1085 against the US Dollar.
- There is a major bullish trend line forming with support near 1.1080 on the hourly chart of EUR/USD.
- USD/CHF is currently declining and it might continue to decline below 0.9830.
- There a key bearish trend line forming with resistance near the 0.9865 level on the hourly chart.
EUR/USD Technical Analysis
This week, the Euro found support above the main 1.1025 area (the last swing low was formed near 1.1039 on FXOpen) against the US Dollar. As a result, the EUR/USD pair started a fresh recovery above the 1.1050 resistance.
Moreover, the pair broke the 1.1075 resistance area and the 50 hourly simple moving average. The pair is now trading above the 61.8% Fib retracement level of the downward move from the 1.1109 high to 1.1039 low.
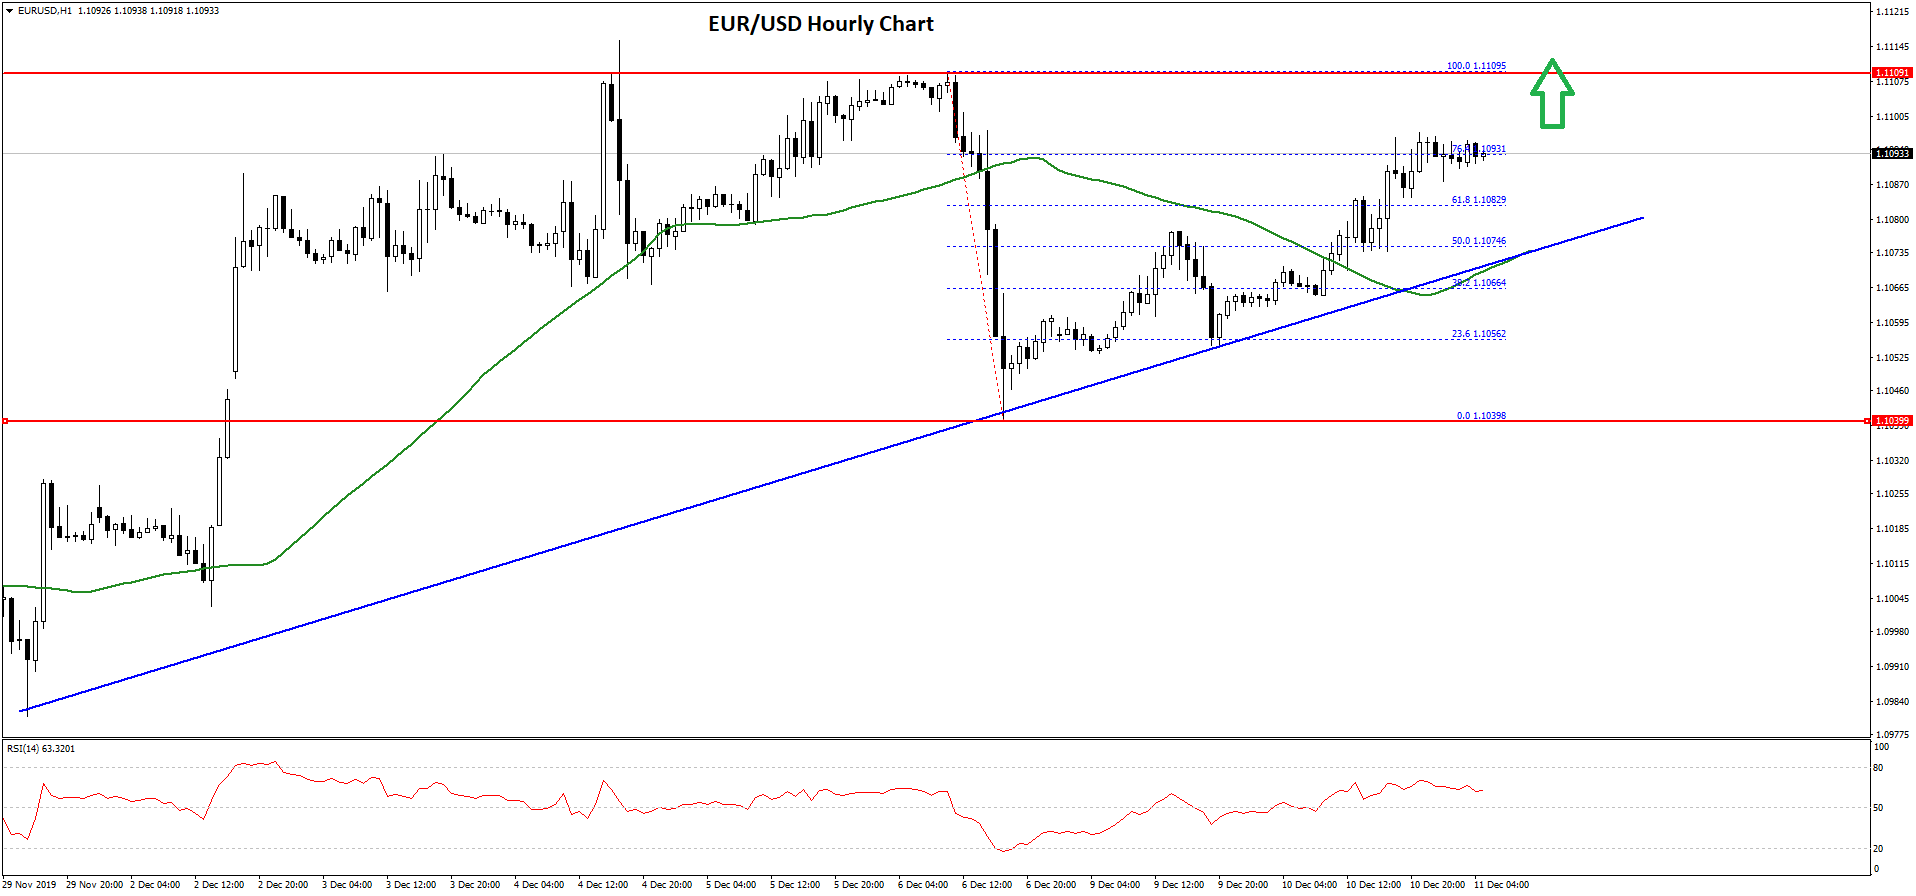
At the moment, the pair is trading near the 1.1095 area, plus the 76.4% Fib retracement level of the downward move from the 1.1109 high to 1.1039 low.
If there is an upside break above 1.1095 and 1.1100, EUR/USD is likely to accelerate higher in the near term. In the mentioned case, the pair could even surpass the 1.1110 and 1.1120 levels.
On the downside, there are many supports near 1.1075 and 1.1050. Besides, there is a major bullish trend line forming with support near 1.1080 on the hourly chart of EUR/USD.
If there is a downside break below the 1.1075 support and the 50 hourly simple moving average, the pair could move back into a bearish zone. The next major support is seen near the 1.1050 level, followed by the 1.1039 swing low.
Overall, the pair remains well bid above 1.1075 and it is likely to climb above the 1.1100 resistance area in the near term.
USD/CHF Technical Analysis
The US Dollar remained under a lot of selling pressure below the 1.0000 handle against the Swiss franc. The USD/CHF pair followed a bearish path below the 0.9950 and 0.9900 levels.
Moreover, the pair settled below the 0.9900 area and the 50 hourly simple moving average. The recent decline was such that the pair even broke the 0.9850 support and traded as low as 0.9833.
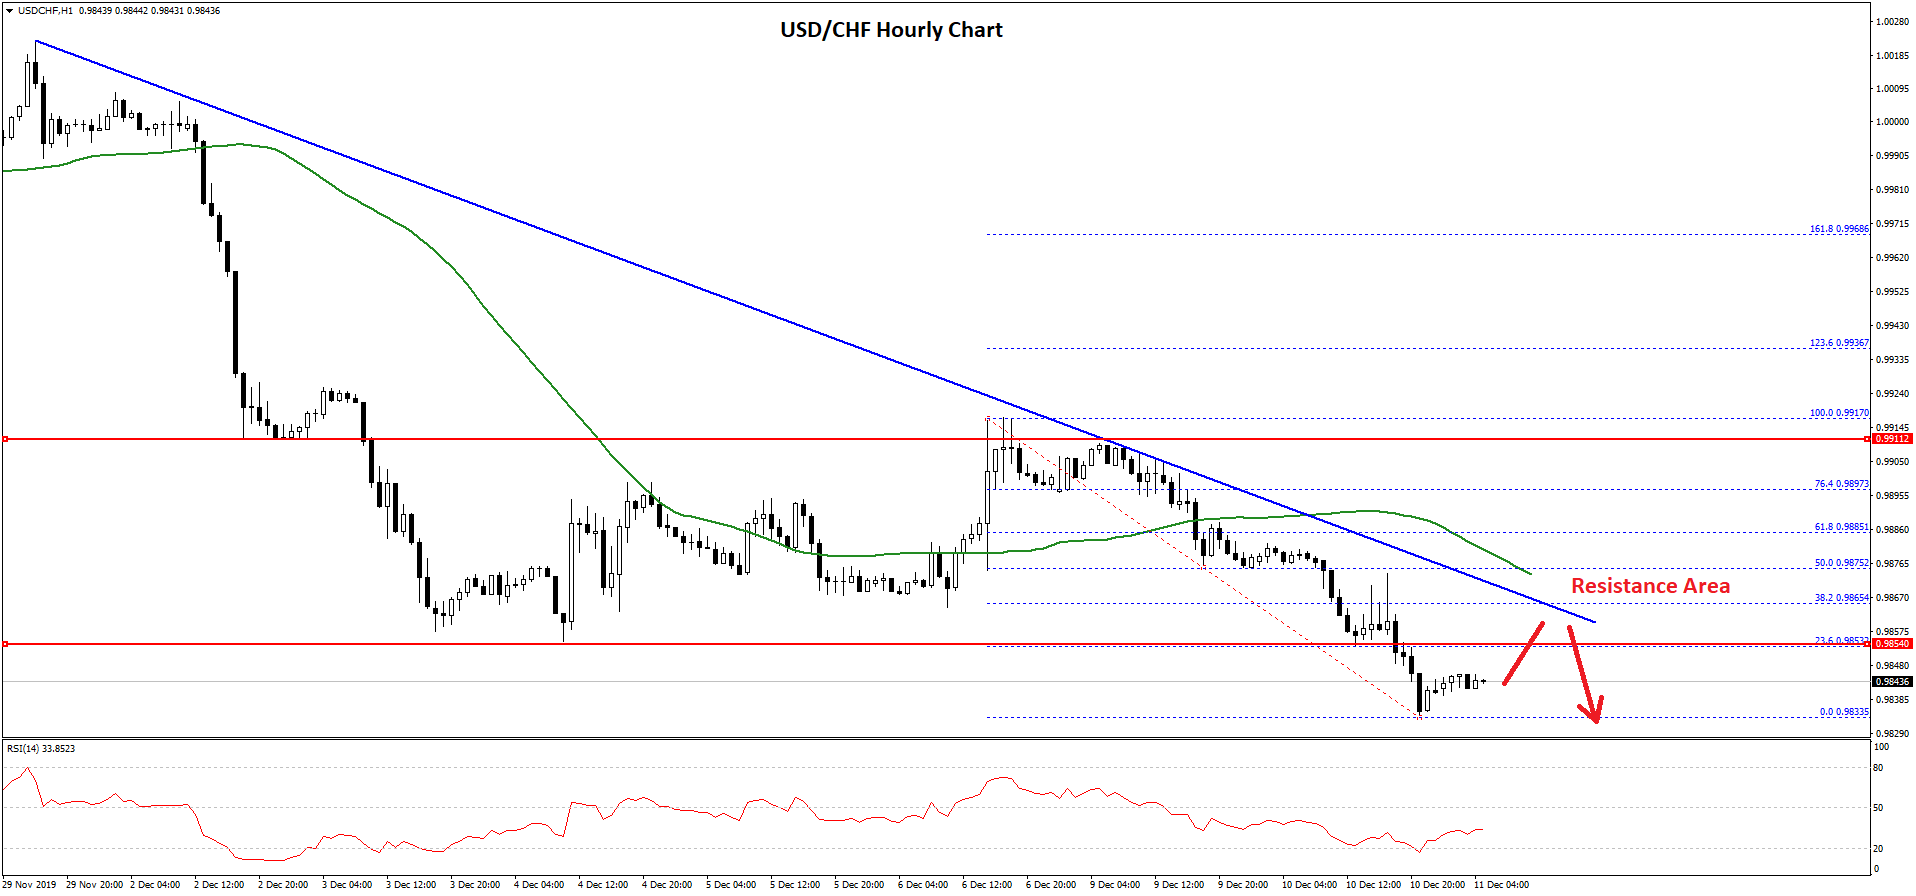
It is currently consolidating losses and trading above the 0.9840 level. An initial resistance is near the 0.9855 level (the previous support area). Besides, the 23.6% Fib retracement level of the recent decline from the 0.9917 high to 0.9833 low is also near the 0.9855 area.
More importantly, there is a key bearish trend line forming with resistance near the 0.9865 level on the hourly chart. If there is an upside break above the trend line, the pair could recover towards the 0.9875 resistance.
The 50 hourly SMA is waiting near the 0.9875 level to prevent gains. Besides, the 50% Fib retracement level of the recent decline from the 0.9917 high to 0.9833 low is also near the 0.9875 level.
Therefore, USD/CHF is likely to remain in a downtrend unless there is a close above the 0.9875 and 0.9900 resistance levels in the near term.
Trade over 50 forex markets 24 hours a day with FXOpen. Take advantage of low commissions, deep liquidity, and spreads from 0.0 pips. Open your FXOpen account now or learn more about trading forex with FXOpen.
This article represents the opinion of the Companies operating under the FXOpen brand only. It is not to be construed as an offer, solicitation, or recommendation with respect to products and services provided by the Companies operating under the FXOpen brand, nor is it to be considered financial advice.
Latest from Forex Analysis
Latest articles

Since the Start of the Week, Brent Oil Price Has Dropped over 4%
At the beginning of the week, March 15, we wrote that the price of Brent oil could form a correction from the resistance level of USD 91 per barrel. Since then, the price has decreased by more than 4% due

Fair Value Gaps vs Liquidity Voids in Trading
Understanding fair value gaps and liquidity voids is essential for traders seeking to navigate the complexities of the financial markets. These concepts, deeply rooted in the Smart Money Concept (SMC), provide valuable insights into the dynamics of supply and demand,

UK100 Share Index Rises as UK Inflation Slows
Yesterday, the UK Office for National Statistics (ONS) reported that the CPI stood at 3.2% in March. According to ForexFactory, analysts expected 3.1%, and a month ago the index was 3.4%.
Grant Fitzner, chief economist at the