


FXOpen

EUR/USD remained well bid above 1.2120 and it is currently rising. USD/CHF is declining and it might continue to move down towards the 0.8820 support zone.
Important Takeaways for EUR/USD and USD/CHF
- The Euro declined heavily from 1.2350, but it found support near 1.2130 against the US Dollar.
- There was a break above a major bearish trend line with resistance near 1.2200 on the hourly chart of EUR/USD.
- USD/CHF formed a short-term top near 0.8920 and recently corrected lower.
- There was a break below a key bullish trend line with support near 0.8888 on the hourly chart.
EUR/USD Technical Analysis
After a steady increase, the Euro faced a strong resistance near the 1.2350 zone against the US Dollar. The EUR/USD pair formed a swing high at 1.2344 and started a strong decline.
It broke many key supports near 1.2240 and 1.2220. There was also a break below the 1.2180 support level and the 50 hourly simple moving average. Finally, the pair found support above 1.2130. A low is formed near 1.2133 on FXOpen and the pair is currently rising.
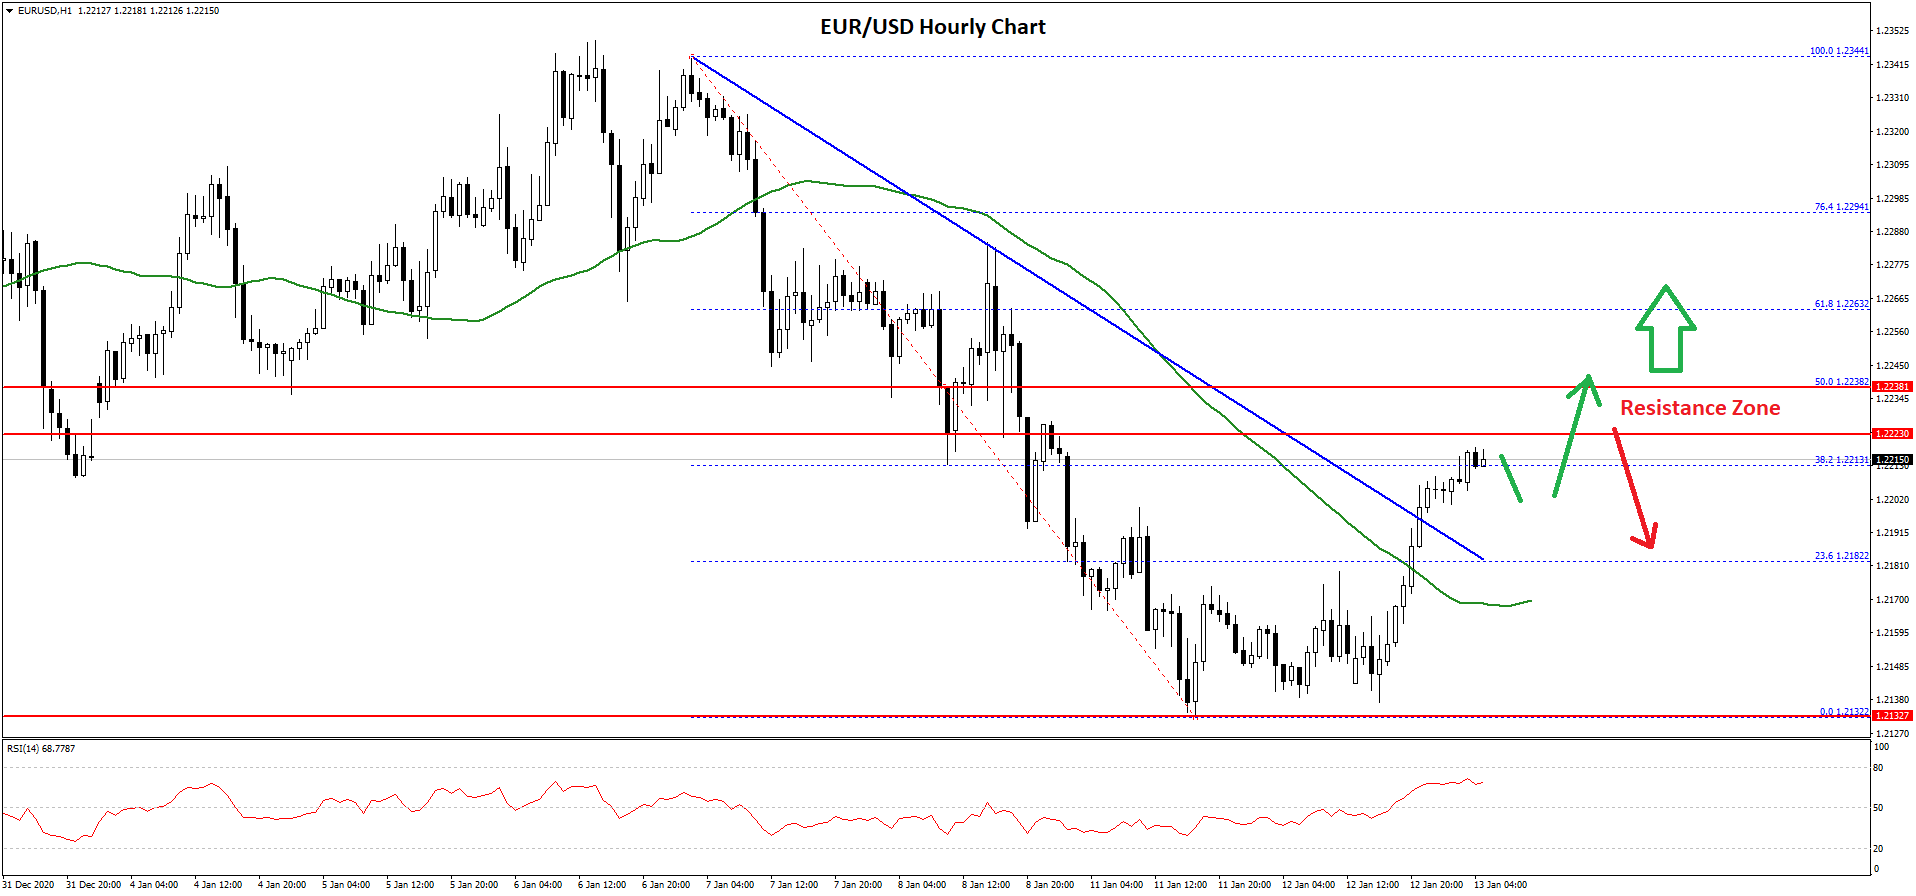
It broke the 1.2180 resistance level and the 50 hourly simple moving average. There was a break above the 23.6% Fib retracement level of the downward move from the 1.2344 high to 1.2133 low.
There was also a break above a major bearish trend line with resistance near 1.2200 on the hourly chart of EUR/USD. The pair is now trading above the 1.2200 level. An initial resistance is near the 1.2222 level. The first major resistance is near the 1.2240 level.
The 50% Fib retracement level of the downward move from the 1.2344 high to 1.2133 low is also near 1.2240 level. Therefore, a break above 1.2240 could accelerate upsides towards 1.2300.
If not, the pair could start a fresh decline from 1.2240. An initial support is near the 1.2185 level. The next major support is near the 1.2170 level. Any more losses could lead the pair towards the 1.2100 zone.
USD/CHF Technical Analysis
The US Dollar followed a strong bullish path above the 0.8850 level against the Swiss franc. The USD/CHF pair even broke the 0.8900 level, but it struggled to clear the 0.8920 zone.
A high was formed near 0.8920 before the pair started a downside correction. There was a break below the 0.8900 support level and the 50 hourly simple moving average to open the doors for a major correction.
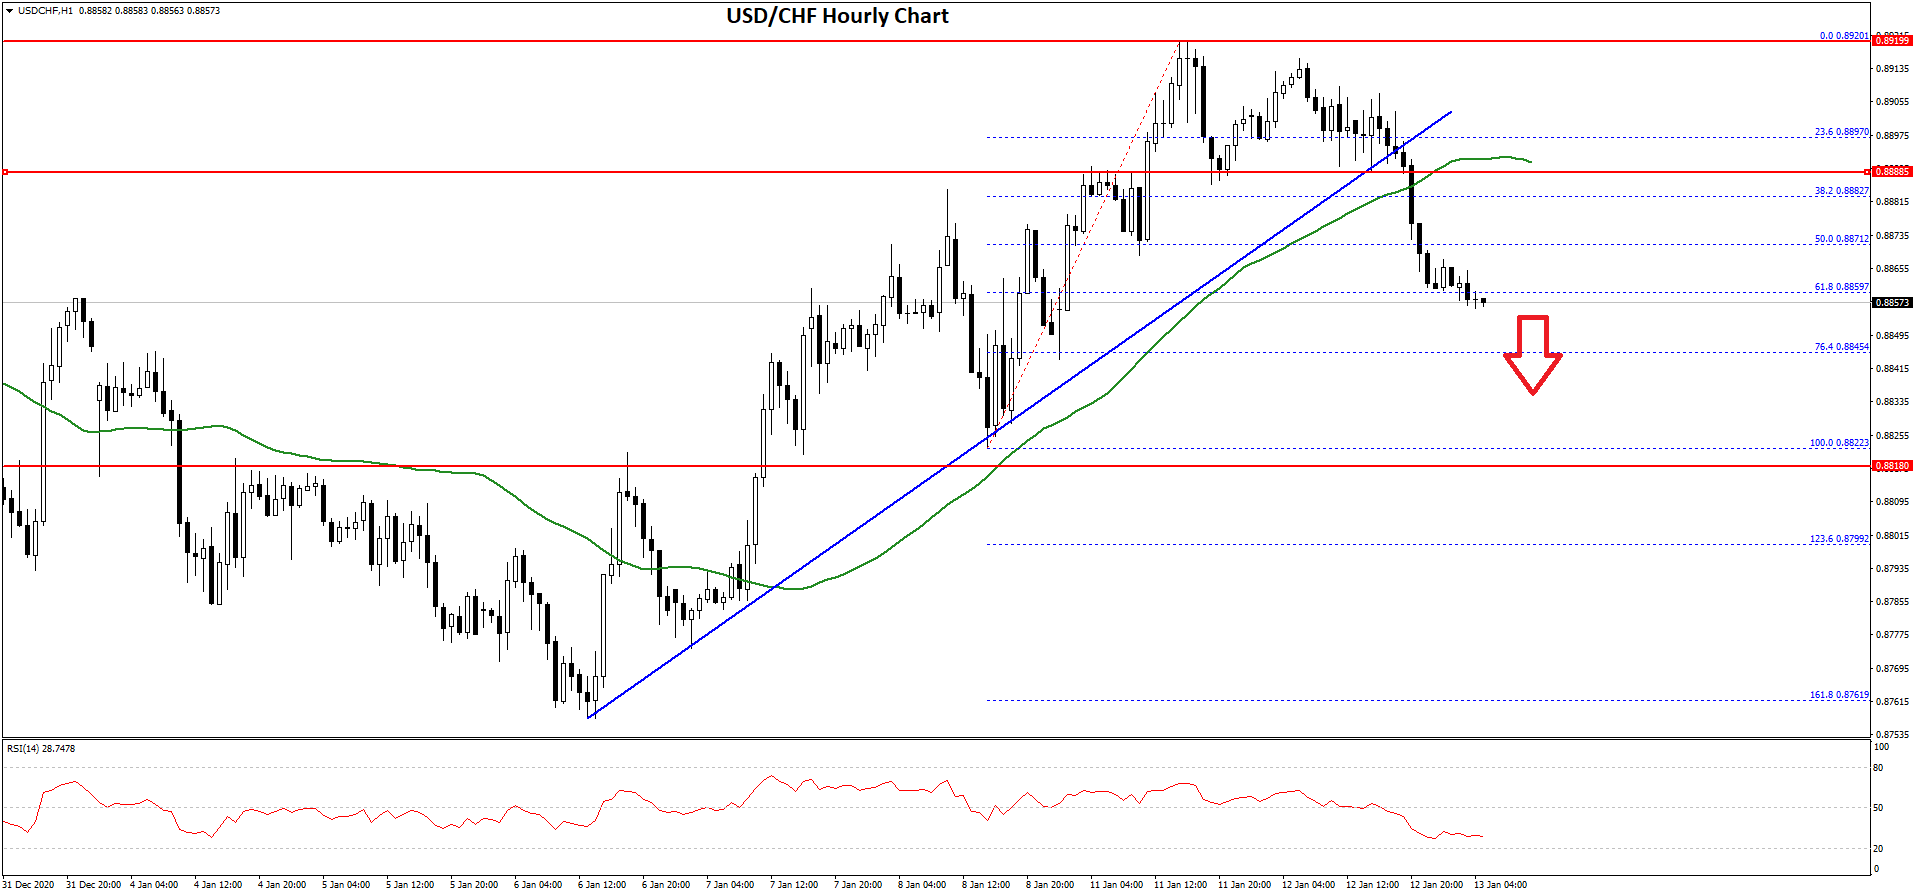
There was also a break below a key bullish trend line with support near 0.8888 on the hourly chart. The pair broke the 50% Fib retracement level of the upward move from the 0.8822 swing low to 0.8920 high.
The pair could continue to move down towards the 0.8845 support. It is close to the 76.4% Fib retracement level of the upward move from the 0.8822 swing low to 0.8920 high. Any more losses might call for a test of the 0.8820 support.
On the upside, an initial resistance is near the 0.8870 level. The main resistance is forming near the 0.8890 level and the 50 hourly simple moving average.
A close above the 0.8880 and 0.8890 levels could open the doors for another steady increase above 0.8900 in the near term.
Trade over 50 forex markets 24 hours a day with FXOpen. Take advantage of low commissions, deep liquidity, and spreads from 0.0 pips. Open your FXOpen account now or learn more about trading forex with FXOpen.
This article represents the opinion of the Companies operating under the FXOpen brand only. It is not to be construed as an offer, solicitation, or recommendation with respect to products and services provided by the Companies operating under the FXOpen brand, nor is it to be considered financial advice.
Latest from Forex Analysis
Latest articles

How to Identify and Trade Liquidity Grabs
Understanding the intricacies of market liquidity and the role of liquidity grabs can be crucial for optimising trading strategies. Liquidity grabs, creating rapid price movements, are a key component of Smart Money trading. This article explores how to identify these

What Is a Piercing Line Pattern, and How Can You Trade with It?
In the world of technical analysis, the piercing line pattern stands out as a solid indicator of potential market reversals. This article delves into the nuances of this two-candlestick pattern, exploring its formation, significance, and how traders can effectively leverage

London Calling! FTSE 100 Stocks Flying High Once Again
Back in 2021, which when looking at a physical calendar does not seem such a long time ago yet feels an epoch ago when considering the changes in global economies and the capital markets since then, the FTSE 100 index