


FXOpen

EUR/USD is gaining pace above the 1.2200 resistance zone. USD/JPY is showing bearish signs below the 108.85 and 109.00 resistance levels.
Important Takeaways for EUR/USD and USD/JPY
- The Euro started a fresh increase above the 1.2200 resistance zone.
- There is a key bullish trend line forming with support near 1.2240 on the hourly chart of EUR/USD.
- USD/JPY declined below the 109.20 and 109.00 support levels.
- There is a major bearish trend line forming with resistance near 109.00 on the hourly chart.
EUR/USD Technical Analysis
After forming a base above the 1.2050 level, the Euro started a fresh increase against the US Dollar. The EUR/USD pair broke the 1.2150 resistance level to move into a positive zone.
The pair even broke the 1.2200 level and settled nicely above the 50 hourly simple moving average. A high is formed near 1.2263 on FXOpen and the pair is now consolidating gains. It corrected lower below the 1.2250 support zone.
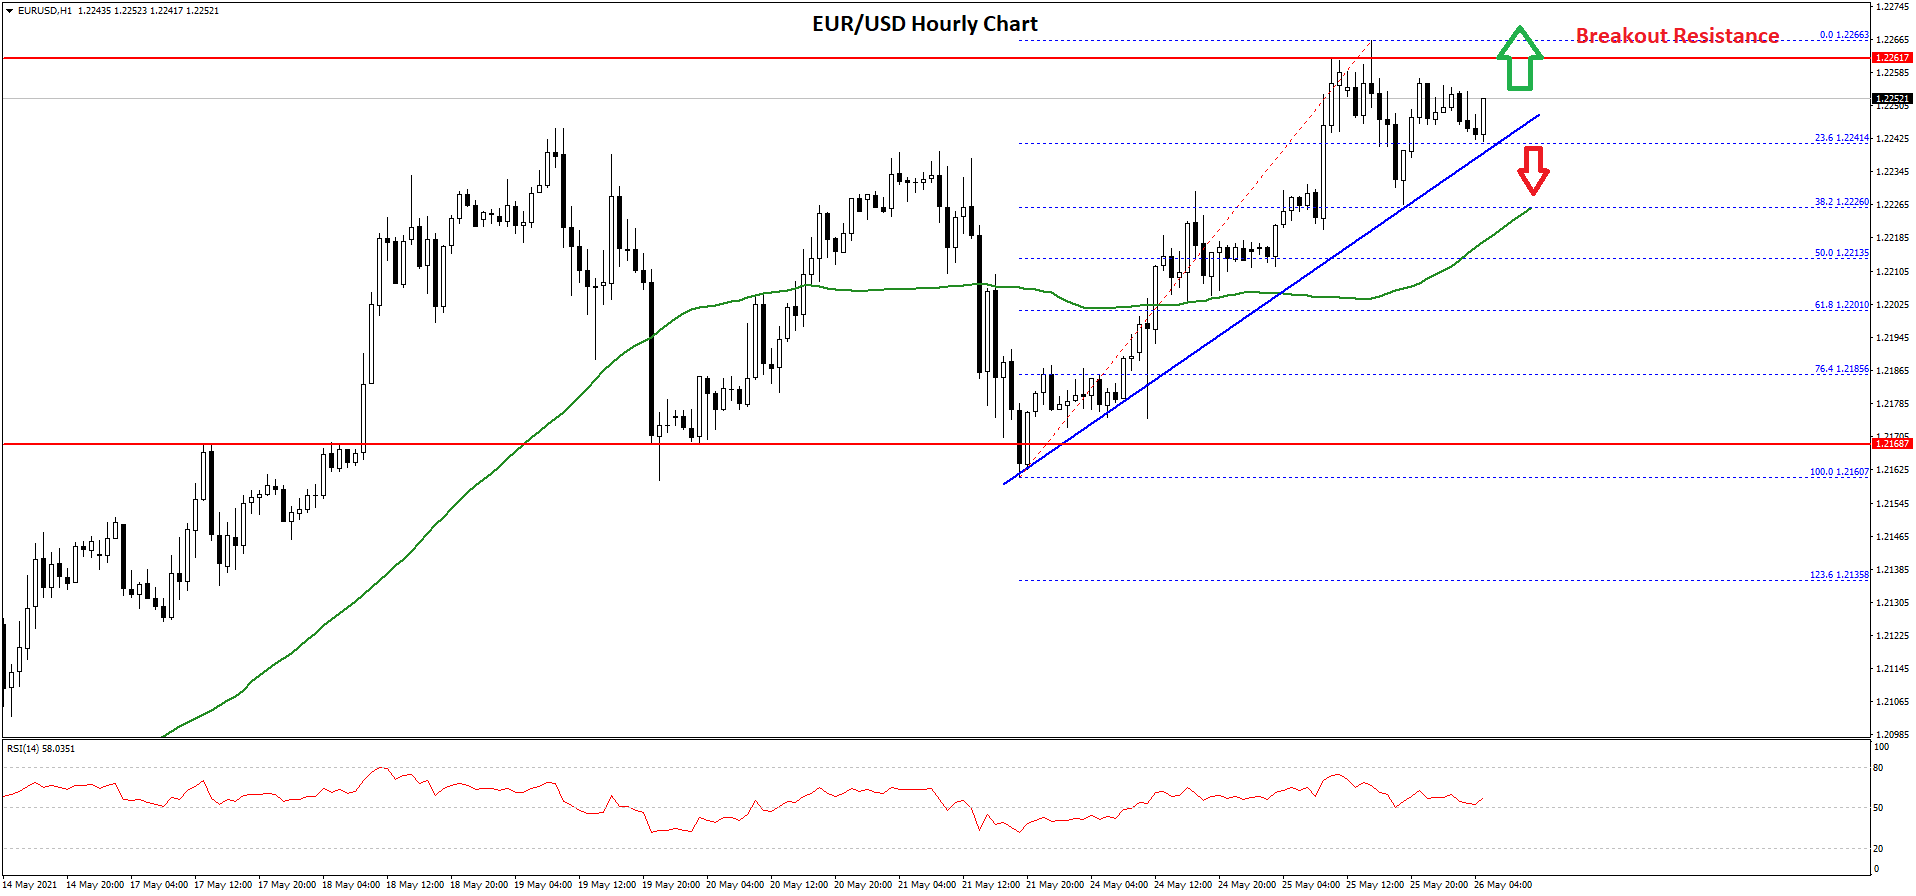
There was a break below the 23.6% Fib retracement level of the recent wave from the 1.2160 swing low to 1.2263 high. However, the pair is holding the 1.2200 support zone.
There is also a key bullish trend line forming with support near 1.2240 on the hourly chart of EUR/USD. If there is a downside break below the trend line, the pair could test the 1.2210 zone. It is near the 50% Fib retracement level of the recent wave from the 1.2160 swing low to 1.2263 high.
An intermediate support is near the 1.2225 level and the 50 hourly simple moving average. On the upside, the pair is likely to accelerate higher if it clears 1.2265. The next major resistance is near the 1.2300 level. Any more gains could lead the pair towards the 1.2350 level. An intermediate resistance might be near the 1.2320 level.
USD/JPY Technical Analysis
The US Dollar started a fresh decline from the 109.50 resistance zone against the Japanese Yen. The USD/JPY pair broke the 109.00 support level to move into a bearish zone.
There was also a break below the 108.80 support and the 50 hourly simple moving average. A low was formed near 108.55 before the pair corrected higher. It climbed above 108.80, but failed to settle above 109.00.
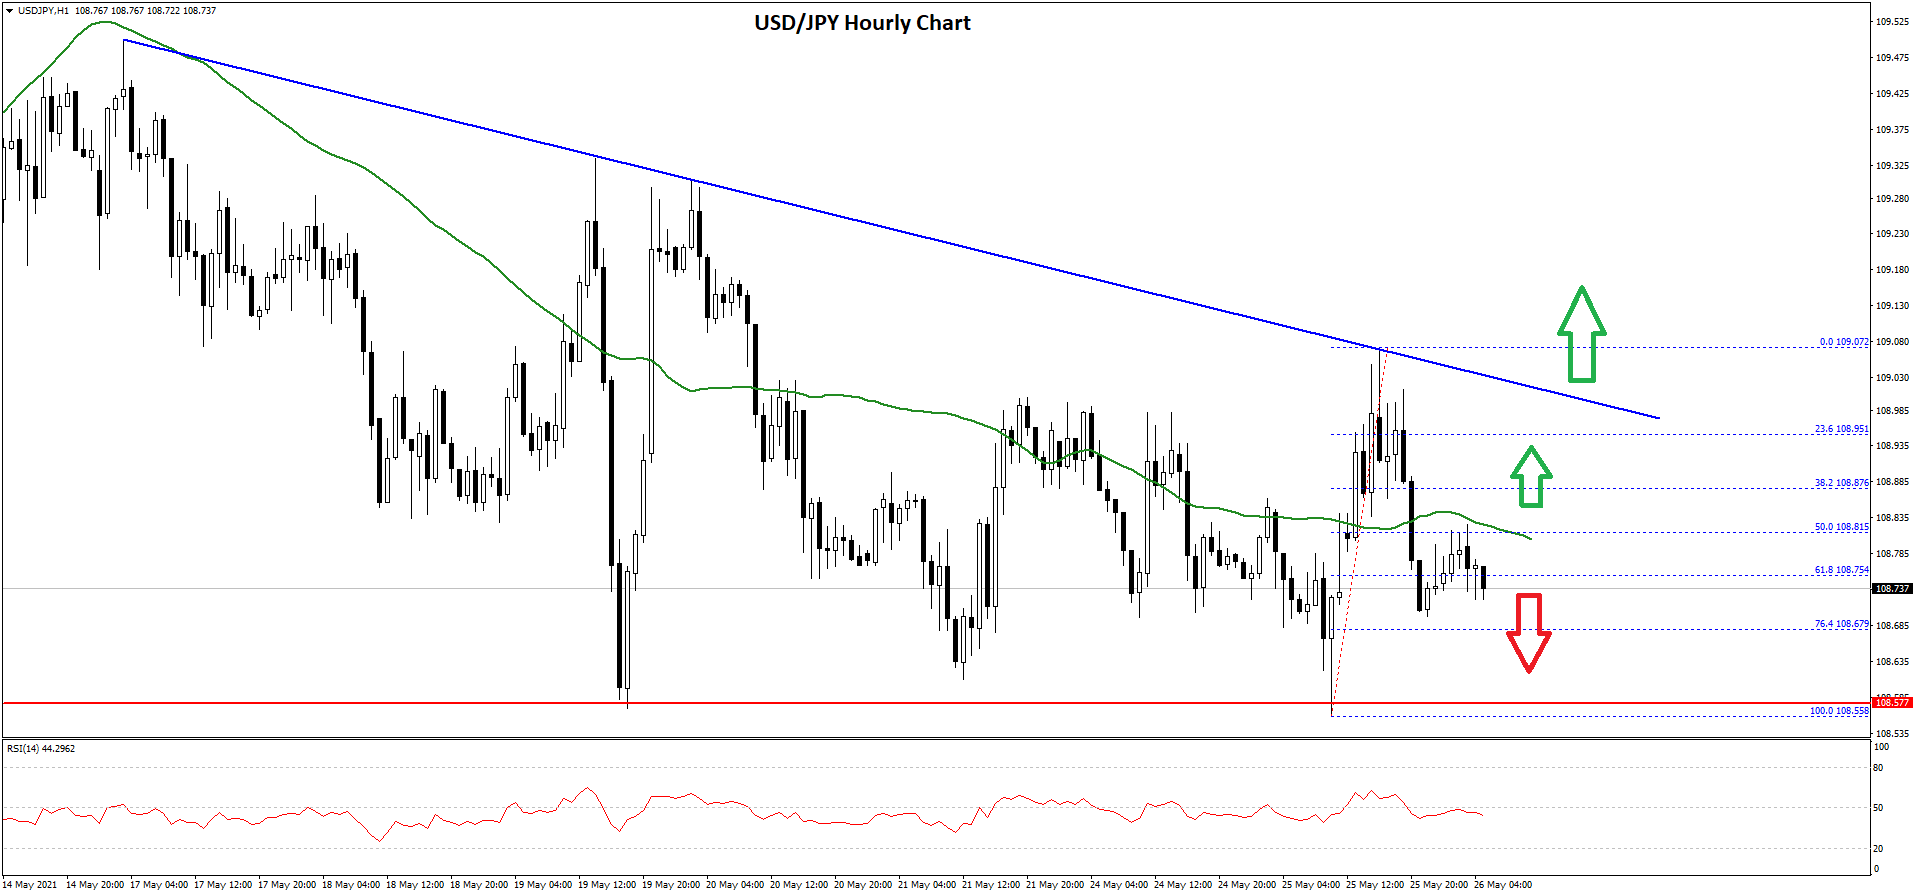
There is also a major bearish trend line forming with resistance near 109.00 on the hourly chart. A high is formed near 109.07 and the pair is now declining. It broke the 50% Fib retracement level of the recent wave from the 108.55 low to 109.07 high.
An immediate support is near the 108.68 level. It is near the 76.4% Fib retracement level of the recent wave from the 108.55 low to 109.07 high.
The main support is near the 108.50 level. A downside break and close below 108.50 could open the doors for a larger decline. The next major support could be 108.00, followed by 107.60.
On the upside, the pair is facing a major hurdle near 109.00. If the pair breaks the 50 hourly simple moving average and then 109.00, it could start a steady increase.
In the stated case, the USD/JPY pair might rise towards the 109.50 level. The next major hurdle for the bulls could be near the 109.80 and 110.00 levels.
This forecast represents FXOpen Markets Limited opinion only, it should not be construed as an offer, invitation or recommendation in respect to FXOpen Markets Limited products and services or as financial advice.
Trade over 50 forex markets 24 hours a day with FXOpen. Take advantage of low commissions, deep liquidity, and spreads from 0.0 pips. Open your FXOpen account now or learn more about trading forex with FXOpen.
This article represents the opinion of the Companies operating under the FXOpen brand only. It is not to be construed as an offer, solicitation, or recommendation with respect to products and services provided by the Companies operating under the FXOpen brand, nor is it to be considered financial advice.
Latest from Forex Analysis
Latest articles

Since the Start of the Week, Brent Oil Price Has Dropped over 4%
At the beginning of the week, March 15, we wrote that the price of Brent oil could form a correction from the resistance level of USD 91 per barrel. Since then, the price has decreased by more than 4% due

Fair Value Gaps vs Liquidity Voids in Trading
Understanding fair value gaps and liquidity voids is essential for traders seeking to navigate the complexities of the financial markets. These concepts, deeply rooted in the Smart Money Concept (SMC), provide valuable insights into the dynamics of supply and demand,

UK100 Share Index Rises as UK Inflation Slows
Yesterday, the UK Office for National Statistics (ONS) reported that the CPI stood at 3.2% in March. According to ForexFactory, analysts expected 3.1%, and a month ago the index was 3.4%.
Grant Fitzner, chief economist at the