


FXOpen
EUR/USD jumped above the 1.1450 resistance and recovered losses. USD/CHF is under pressure and it remains at a risk of a downside break below 0.9800.
Important Takeaways for EUR/USD and USD/CHF
- The Euro bounced back and broke the 1.1360 and 1.1440 resistance levels against the US Dollar.
- There is a major bullish trend line formed with support at 1.1432 on the hourly chart of EUR/USD.
- USD/CHF declined recently and settled below the 0.9840 support level.
- The pair may continue to move down if there is no break above 0.9840 and 0.9850.
EUR/USD Technical Analysis
The Euro found a strong buying interest near the 1.1300 support against the US Dollar. The EUR/USD pair started a solid recovery and jumped above the 1.1360, 1.1400 and 1.1440 resistance levels.
The pair even rallied above the 1.1450 resistance area and the 50 hourly simple moving average. Buyers pushed the price above the 1.1480 level and a high was formed at 1.1484 on FXOpen.
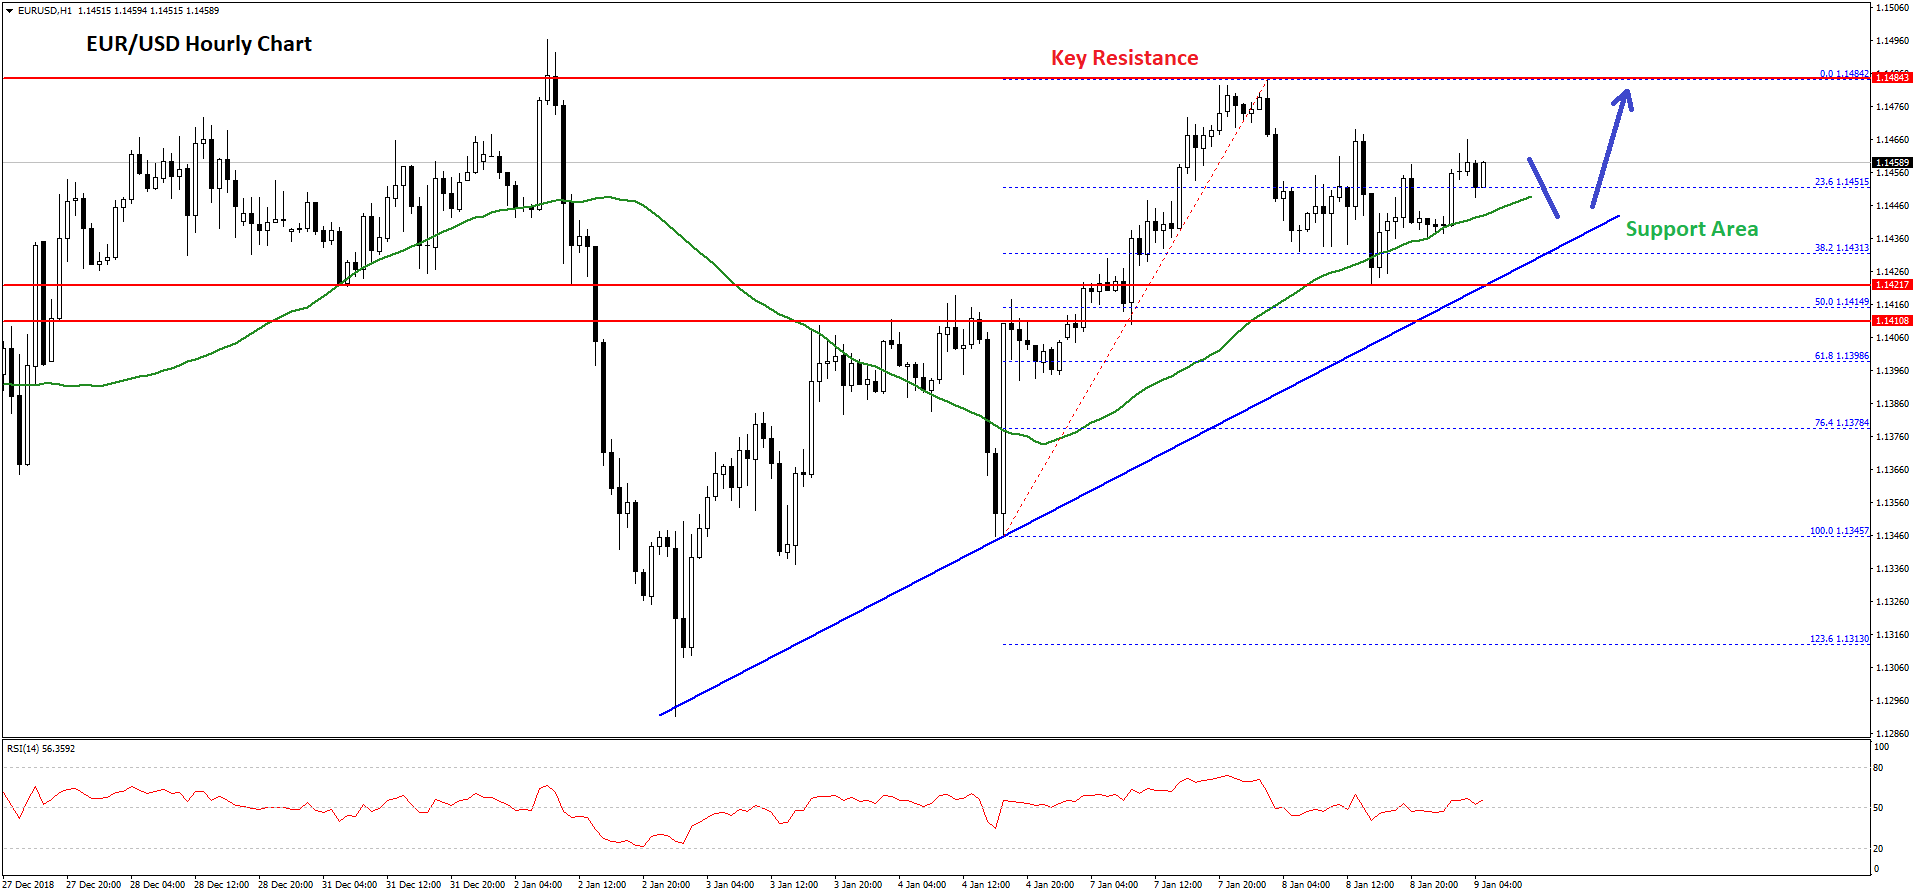
Later, the pair started a downside correction and traded below the 1.1450 level. There was a break below the 38.2% Fib retracement level of the last wave from the 1.1345 low to 1.1484 high. However, there are many supports on the downside near the 1.1420 level.
There is also a major bullish trend line formed with support at 1.1432 on the hourly chart of EUR/USD. Below the trend line, the next key support is at 1.1415. It represents the 50% Fib retracement level of the last wave from the 1.1345 low to 1.1484 high.
Therefore, the pair remains well supported above the 1.1415 level and the 1.1420 pivot level. On the upside, a break above the 1.1480 and 1.1485 resistance levels is needed for more gains above 1.1500 in the near term.
USD/CHF Technical Analysis
The US Dollar failed to hold gains above the 0.9860 and 0.9840 support levels against the Swiss franc. The USD/CHF pair declined heavily and traded towards the 0.9790-0.9800 support area.
There was even a close below the 0.9840 level and the 50 hourly simple moving average. The pair traded as low as 0.9787 and later started an upside correction. It recovered above 0.9810 and the 23.6% Fib retracement level of the recent decline from the 0.9907 high to 0.9787 low.
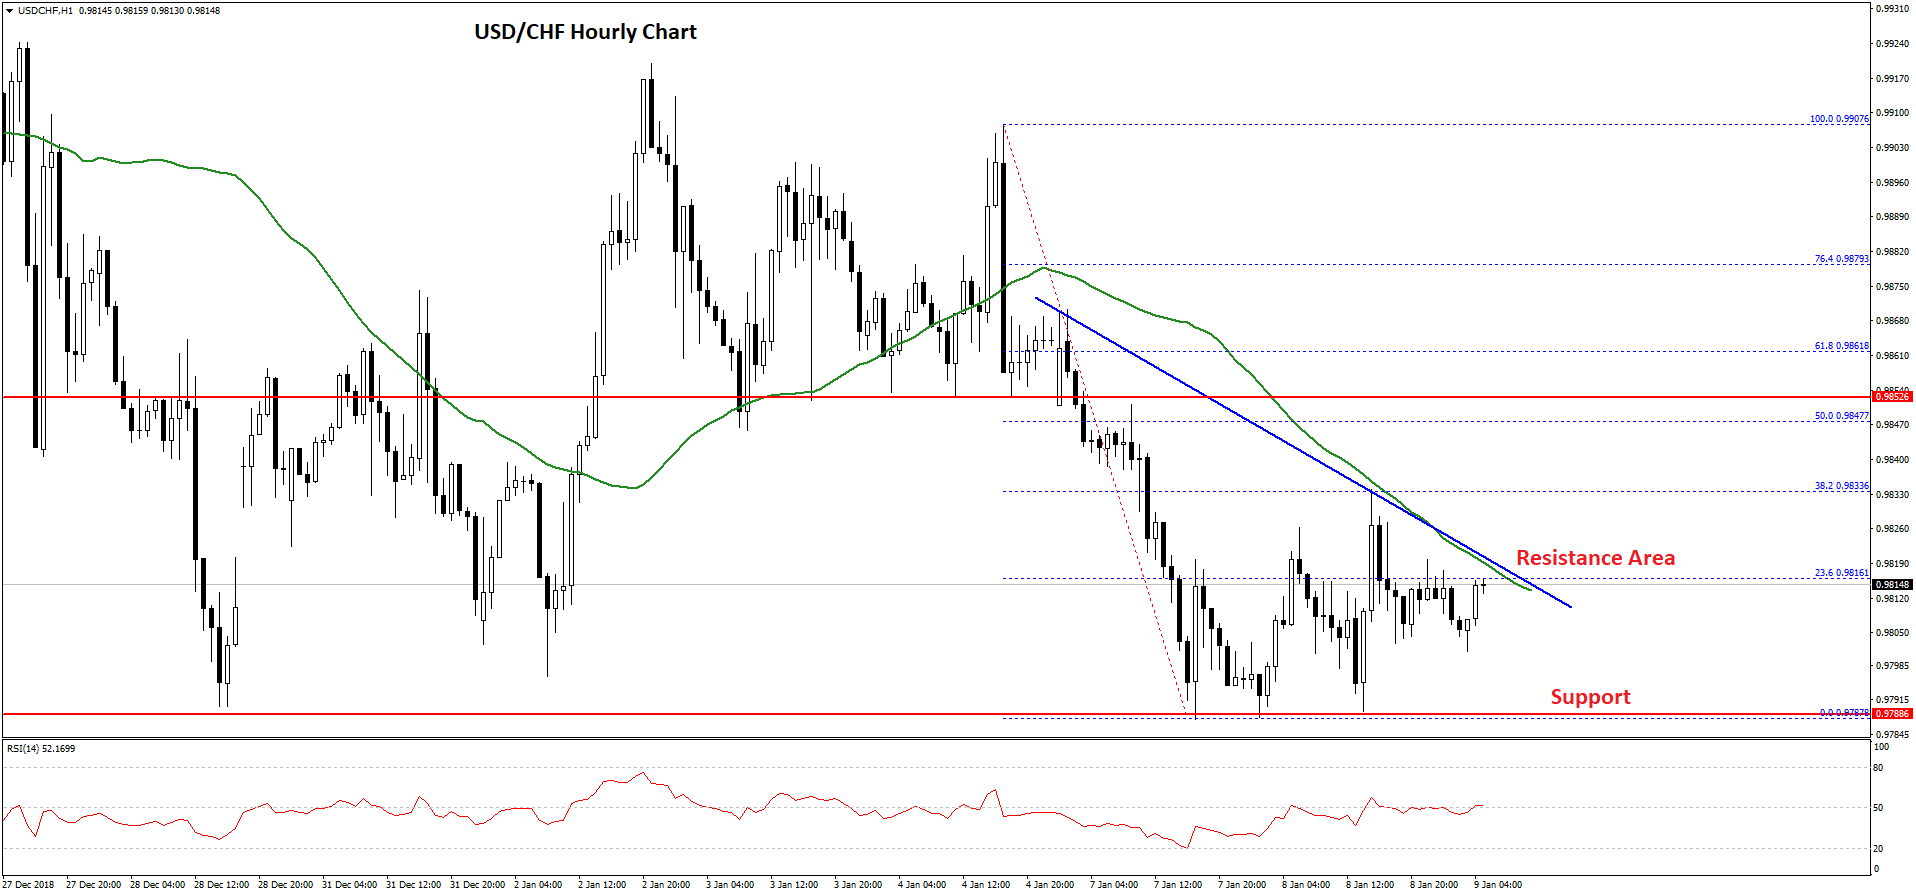
However, there are many hurdles for buyers near the 0.9815 and the 50 hourly SMA. Moreover, there is a connecting bearish trend line in place with resistance at 0.9817 on the hourly chart.
Above the trend line, the pair may face sellers near the 0.9840 level and the 50% Fib retracement level of the recent decline from the 0.9907 high to 0.9787 low. If there is a proper close above the 0.9840 and 0.9850 resistance levels, there could be more gains in USD/CHF.
On the other hand, if there is a bearish reaction, the pair may break the 0.9800 and 0.9790 support levels. The next major support is at 0.9750, which may protect further losses.
Overall, USD/CHF may continue to struggle as long as it is below 0.9850 and a downside break below 0.9790 may accelerate losses.
Trade over 50 forex markets 24 hours a day with FXOpen. Take advantage of low commissions, deep liquidity, and spreads from 0.0 pips. Open your FXOpen account now or learn more about trading forex with FXOpen.
This article represents the opinion of the Companies operating under the FXOpen brand only. It is not to be construed as an offer, solicitation, or recommendation with respect to products and services provided by the Companies operating under the FXOpen brand, nor is it to be considered financial advice.
Latest from Forex Analysis
Latest articles

Anchored VWAP and How You Can Use It in Forex Trading
In the world of forex trading, understanding the nuanced tools at your disposal can significantly enhance decision-making processes. One such sophisticated tool is the Anchored Volume-Weighted Average Price (Anchored VWAP), which refines the standard VWAP by allowing traders to set

META Share Price Collapses after Publication of Quarterly Report
Just yesterday, META's stock price closed at USD 493.50, up approximately 40% since the start of 2024 and up nearly 300% since the start of 2023.
However, following the release of Meta's quarterly report, its shares plummeted to USD

USD/JPY Analysis: The Rate Exceeds The Level of 155 Yen Per US Dollar
Today, the price of USD/JPY once again renewed its 34-year high, exceeding the level of 155 yen per dollar, which put pressure on the current authorities.
According to Reuters, officials are trying to maintain calm in the market.
"We