


FXOpen

EUR/USD seems to be struggling to clear the 1.2180 and 1.2200 resistance levels. USD/CHF is rising and it broke a major hurdle near the 0.9020 level.
Important Takeaways for EUR/USD and USD/CHF
- The Euro is struggling to gain pace above the 1.2165 and 1.2180 levels against the US Dollar.
- There is a key connecting bullish trend line forming with support near 1.2115 on the hourly chart of EUR/USD.
- USD/CHF started a fresh increase after forming a base above the 0.8990 level.
- There was a break above a major bearish trend line with resistance near 0.9032 on the hourly chart.
EUR/USD Technical Analysis
The Euro formed a strong support base above the 1.2000 level against the US Dollar. As a result, the EUR/USD pair started a fresh increase and it broke many hurdles near the 1.2050 and 1.2100 levels.
The pair even surged above the 1.2150 level and settled above the 50 hourly simple moving average. A high was formed near 1.2181 on FXOpen and the pair is now correcting gains. It seems like the pair is struggling to gain pace above the 1.2165 and 1.2180 levels.
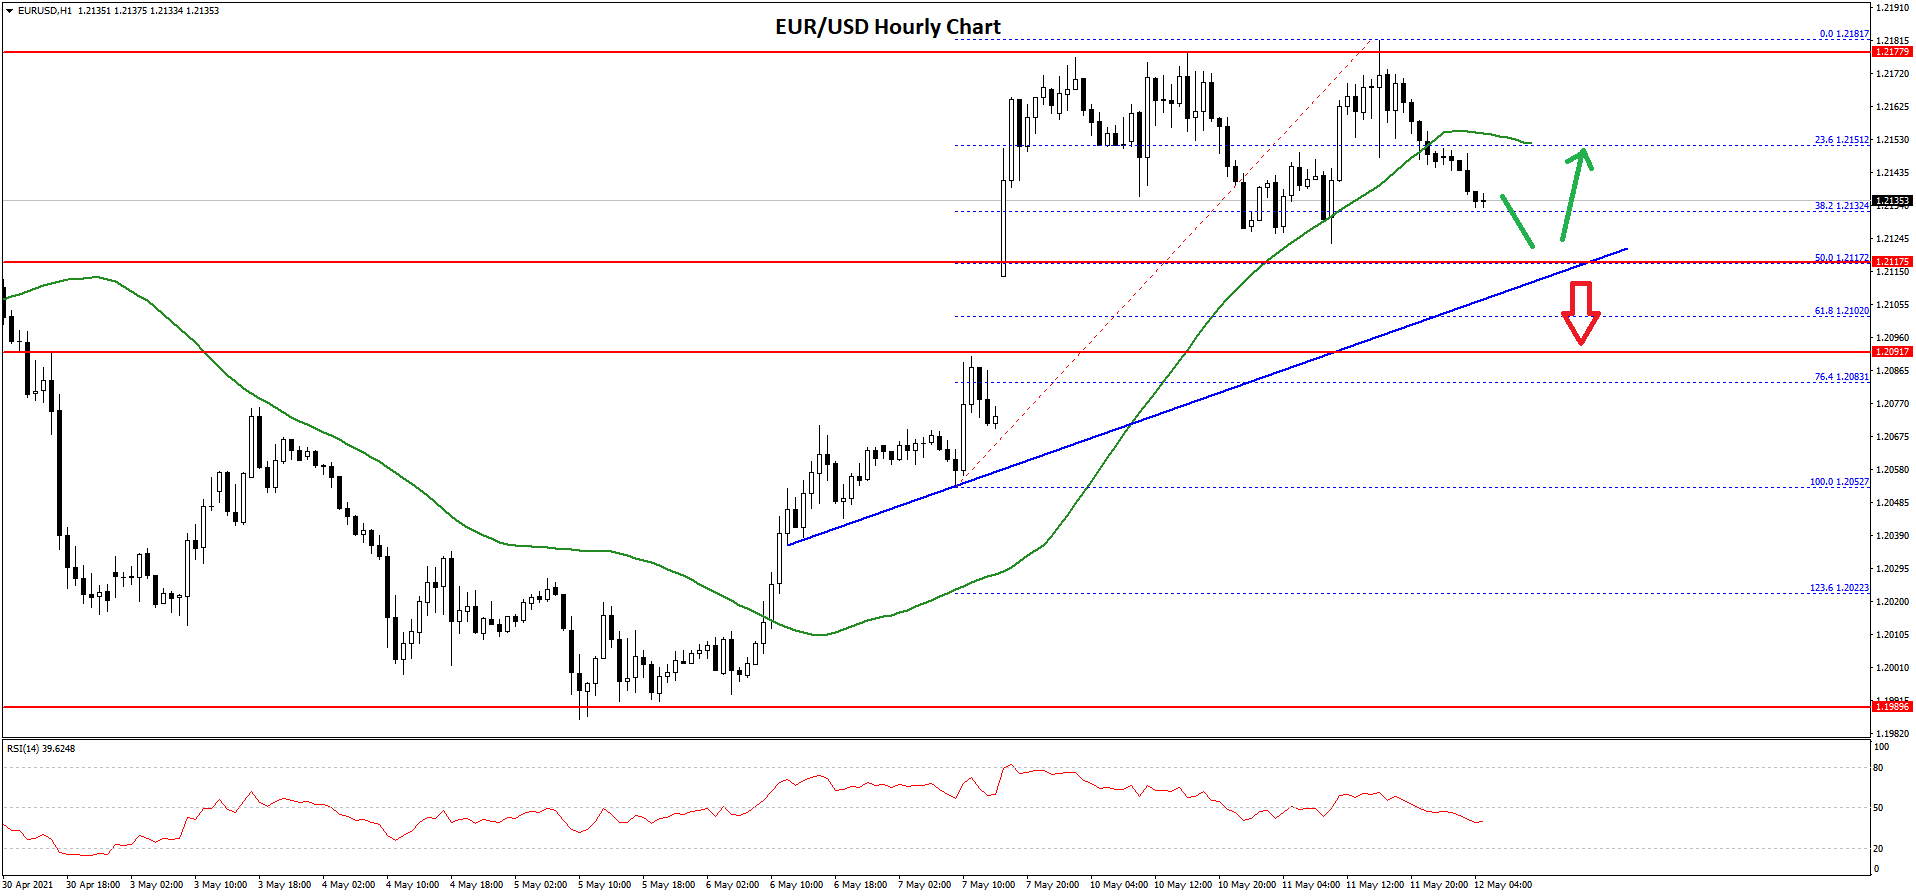
It already corrected lower below the 1.2150 level and the 50 hourly simple moving average. There was a break below the 23.6% Fib retracement level of the upward move from the 1.2052 swing low to 1.2181 high.
On the downside, there is a major support forming near the 1.2120 zone. There is also a key connecting bullish trend line forming with support near 1.2115 on the hourly chart of EUR/USD.
The trend line is close to the 50% Fib retracement level of the upward move from the 1.2052 swing low to 1.2181 high. A downside break below the trend line and 1.2100 could increase selling pressure in the near term.
On the upside, the pair is facing hurdles near the 1.2180 level. The next major resistance is near the 1.2200 level, above which the pair could start a strong increase.
USD/CHF Technical Analysis
The US Dollar struggled to clear 0.9160 and started a fresh decline against the Swiss franc. The USD/CHF pair traded below the 0.9100 support zone to move into a bearish zone.
The pair even broke the 0.9050 support and the 50 hourly simple moving average. The pair traded as low as 0.8985 and it recently started an upside correction. There was a break above the 0.9000 and 0.9020 resistance levels.
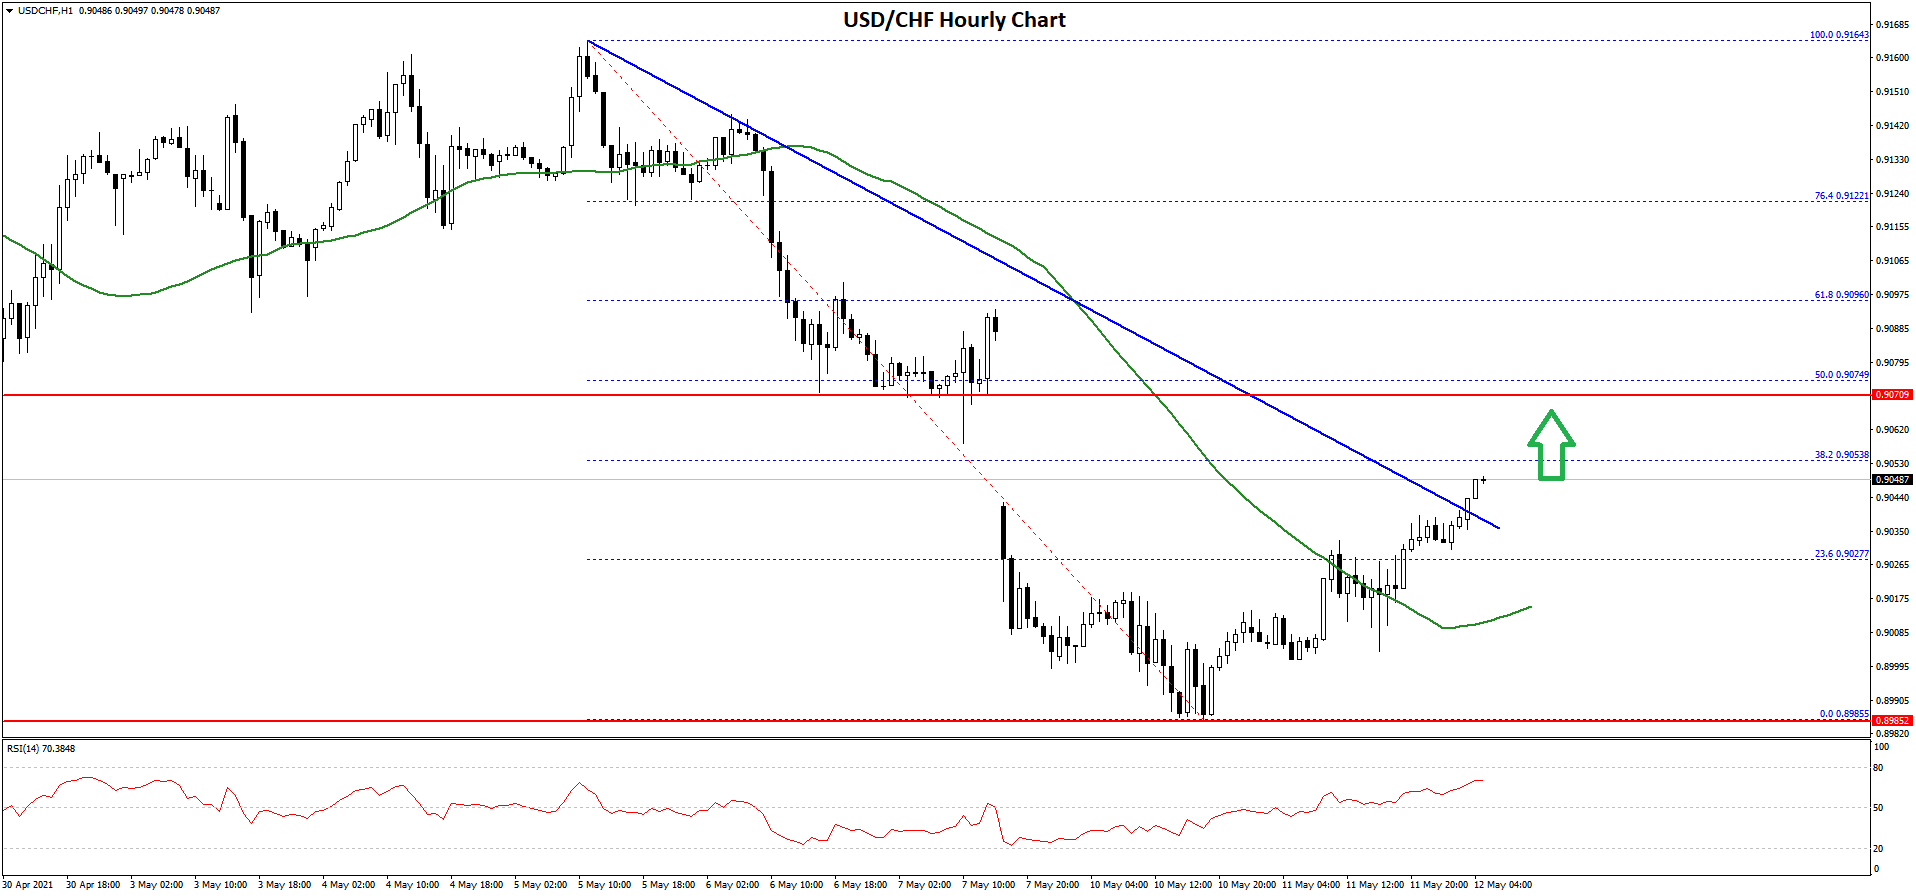
Moreover, there was a break above a major bearish trend line with resistance near 0.9032 on the hourly chart. The pair cleared the 23.6% Fib retracement level of the downward move from the 0.9164 high to 0.8985 low.
The pair is now trading near the 0.9050 level. The first major resistance on the upside is near the 0.9070 zone. The 50% Fib retracement level of the downward move from the 0.9164 high to 0.8985 low.
A successful break above the 0.9070 resistance could open the doors for a steady increase in the coming sessions. The next major resistance is near 0.9100, above which the pair could revisit 0.9165.
On the downside, the pair might find bids near the 0.9020 level and the 50 hourly simple moving average. If the pair fails to stay above 0.9020, there could be a fresh decline towards the 0.8990 support.
This forecast represents FXOpen Markets Limited opinion only, it should not be construed as an offer, invitation or recommendation in respect to FXOpen Markets Limited products and services or as financial advice.
Trade over 50 forex markets 24 hours a day with FXOpen. Take advantage of low commissions, deep liquidity, and spreads from 0.0 pips. Open your FXOpen account now or learn more about trading forex with FXOpen.
This article represents the opinion of the Companies operating under the FXOpen brand only. It is not to be construed as an offer, solicitation, or recommendation with respect to products and services provided by the Companies operating under the FXOpen brand, nor is it to be considered financial advice.
Latest from Forex Analysis
Latest articles

Weekly Market Wrap With Gary Thomson: S&P500, US Dollar, Gold Price, PEP Stocks
Get he latest scoop on the week's hottest headlines, all in one convenient video. Join Gary Thomson, the COO of FXOpen UK, as he breaks down the most significant news reports and shares his expert insights. Read the latest news

The Price of Silver Has Reached Its Highest Level in Over Three Years
As indicated by the XAG/USD chart today, the intraday price of silver reached $29.84 per ounce yesterday, while the previous yearly high on 12 April was $29.79. The last time this price was seen was in February

What Is the Wolfe Wave, and How Can You Trade It?
The Wolfe Waves is a powerful chart pattern recognised for analysing potential price reversals. Named after Bill Wolfe, who developed this formation through extensive trading practice, Wolfe Waves provide traders with a structured approach to anticipate market movements. In this