


FXOpen

EUR/USD started a fresh increase above the 1.1950 and 1.2000 resistance levels. USD/CHF is declining and it could dive if it breaks the 0.9125 support.
Important Takeaways for EUR/USD and USD/CHF
- The Euro started a fresh increase after it settle above 1.1950 against the US Dollar.
- There is a key connecting bullish trend line forming with support near 1.2000 on the hourly chart of EUR/USD.
- USD/CHF is following a bearish path below the 0.9200 support zone.
- There is a major bearish trend line forming with resistance near 0.9170 on the hourly chart.
EUR/USD Technical Analysis
The Euro formed a strong support base above the 1.1950 level against the US Dollar. As a result, the EUR/USD pair started a fresh increase and it broke many hurdles near the 1.1980 and 1.2000 levels.
The pair even surged above the 1.2040 level and settled above the 50 hourly simple moving average. A high was formed near 1.2079 on FXOpen and the pair is now correcting gains. It traded below the 1.2060 and 1.2050 levels.
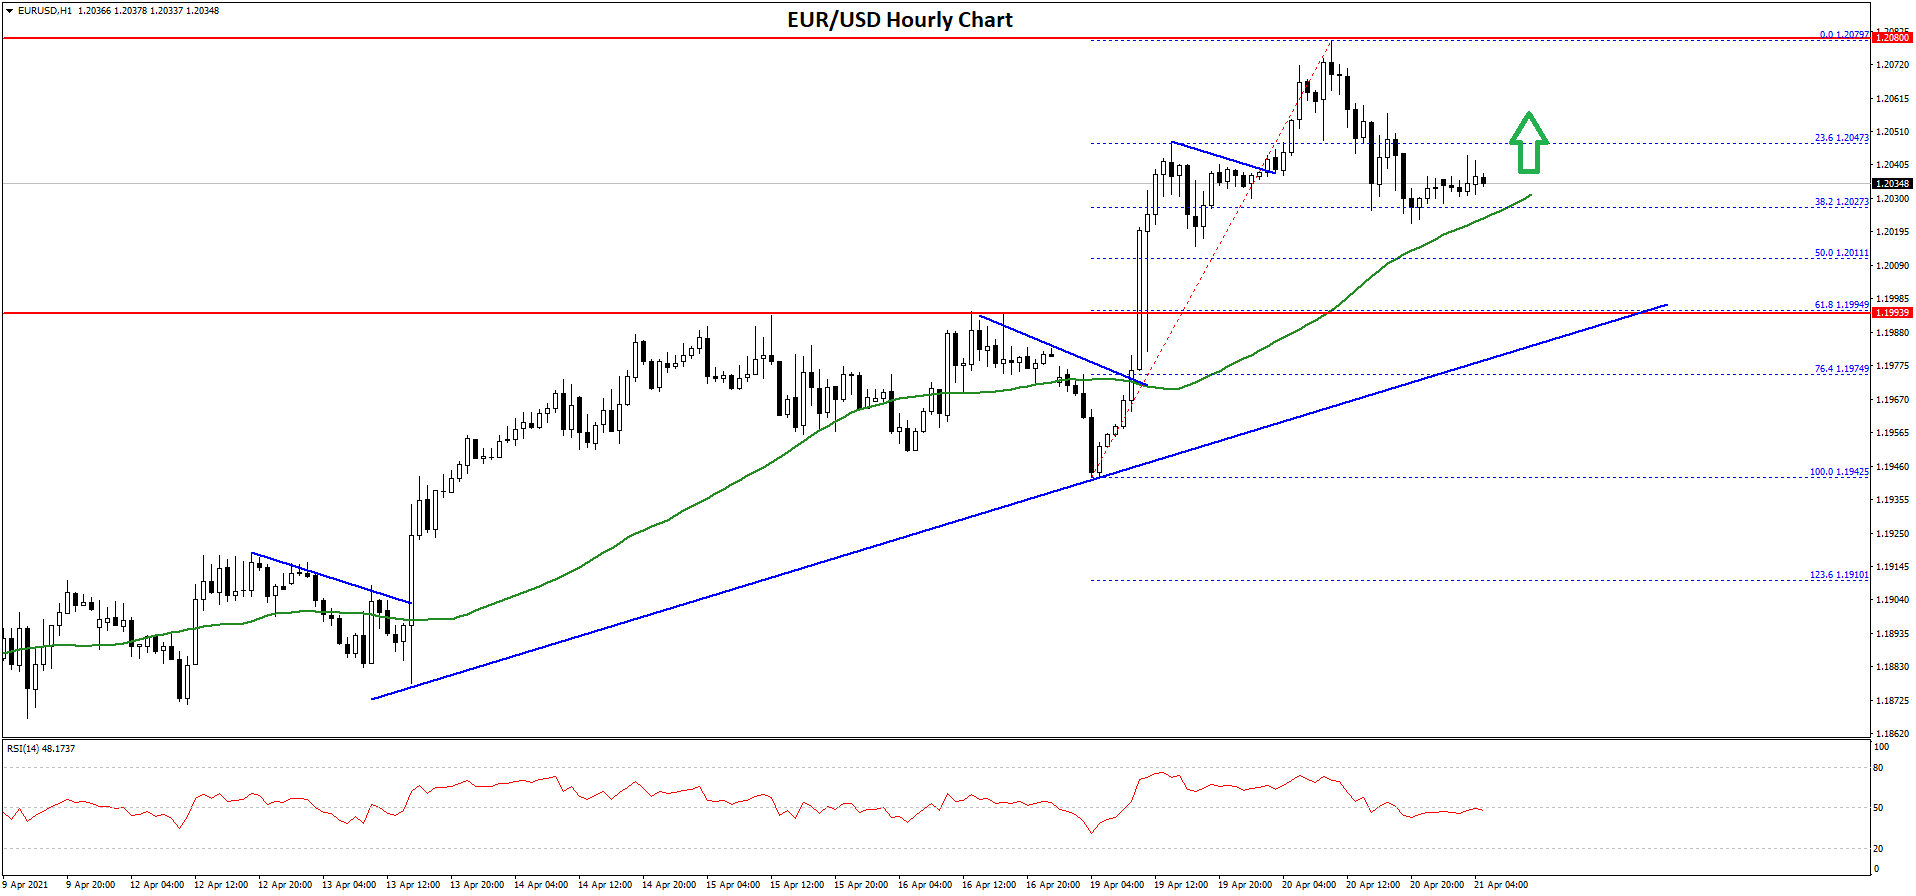
There was a break below the 23.6% Fib retracement level of the upward move from the 1.1942 swing low to 1.2079 high. However, the bulls are defending the 1.2030 support zone and the 50 hourly simple moving average.
The next major support is near the 1.2010 level. It is near the 50% Fib retracement level of the upward move from the 1.1942 swing low to 1.2079 high.
There is also a key connecting bullish trend line forming with support near 1.2000 on the hourly chart of EUR/USD. On the upside, the pair is facing hurdles near the 1.2050 level. The next major resistance is near the 1.2080 level, above which the pair could rise above the 1.2100 zone.
USD/CHF Technical Analysis
The US Dollar struggled to clear 0.9280 and started a fresh decline against the Swiss franc. The USD/CHF pair traded below the 0.9240 support zone to move into a bearish zone.
There was also close below the 0.9200 level and the 50 hourly simple moving average. The pair traded as low as 0.9128 and it recently started an upside correction. It recovered above the 0.9140 level.
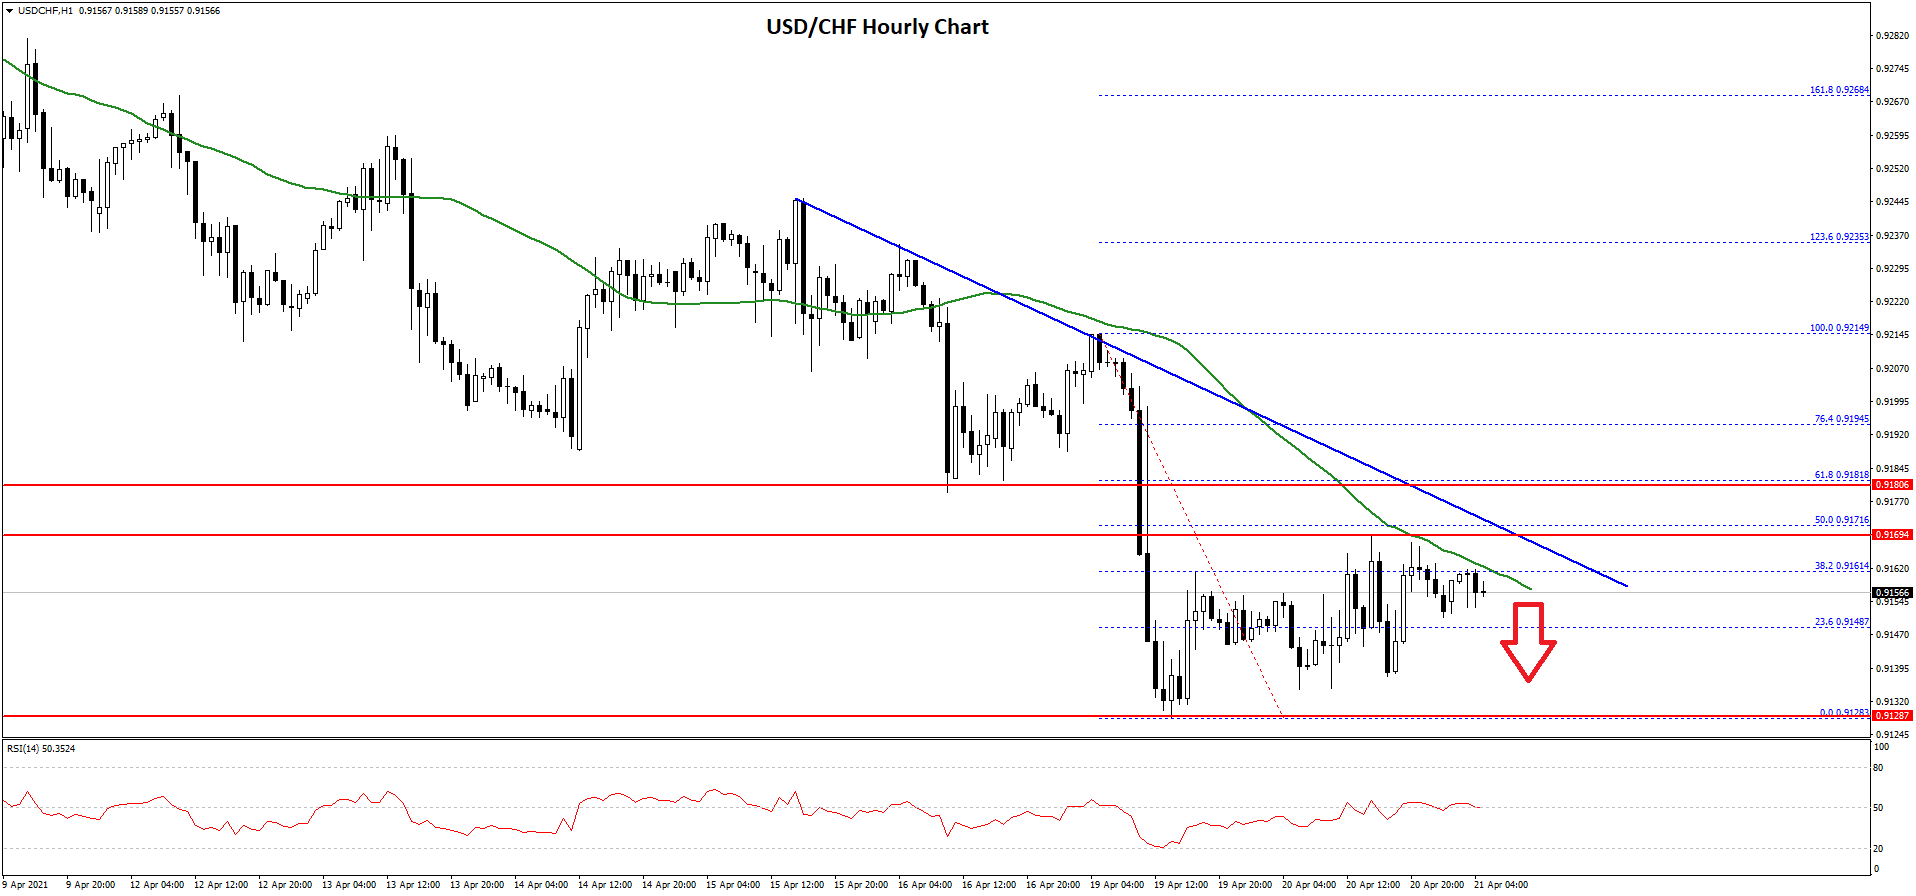
There was a break above the 23.6% Fib retracement level of the downward move from the 0.9214 high to 0.9128 low. At the moment, the pair is facing resistance near the 0.9160 level and the 50 hourly simple moving average.
There is also a major bearish trend line forming with resistance near 0.9170 on the hourly chart. The trend line is close to the 50% Fib retracement level of the downward move from the 0.9214 high to 0.9128 low.
A successful break above the trend line resistance and 0.9180 could open the doors for a steady increase in the coming sessions. The next major resistance is near 0.9200, above which the pair could revisit 0.9250. An intermediate resistance could be near the 0.9225 level.
On the downside, the pair might find bids near the 0.9130 and 0.9125 levels. If the bulls fail to protect the 0.9125 zone, there is a risk of a sharp decline. In the stated case, the USD/CHF pair might decline towards the 0.9050 support zone in the coming sessions.
This forecast represents FXOpen Markets Limited opinion only, it should not be construed as an offer, invitation or recommendation in respect to FXOpen Markets Limited products and services or as financial advice.
Trade over 50 forex markets 24 hours a day with FXOpen. Take advantage of low commissions, deep liquidity, and spreads from 0.0 pips. Open your FXOpen account now or learn more about trading forex with FXOpen.
This article represents the opinion of the Companies operating under the FXOpen brand only. It is not to be construed as an offer, solicitation, or recommendation with respect to products and services provided by the Companies operating under the FXOpen brand, nor is it to be considered financial advice.
Latest from Forex Analysis
Latest articles

USD to CAD Analytical Predictions in 2024, 2025 and Beyond
This comprehensive article delves into the intricacies of the USD to CAD exchange rate, exploring the factors that may influence its trajectory in 2024, 2025, and beyond. From economic outlooks to key market drivers, this article provides valuable insights for

France Joins European Stock Boom as CAC 40 Index Heads for Highs
This decade has been full of market-disrupting surprises, placing it as completely different to any other decade experienced by residents of Western Europe and North America since the end of the Second World War.
The only constant dynamic since the

Gold Price (XAU/USD) Is Testing an Important Resistance Zone
On April 16, we wrote why the $2,380 zone is an important resistance area.

The XAU/USD chart shows that:
1) After fading fluctuations (they formed a narrowing consolidation triangle - shown in green), the price of gold dropped