


FXOpen

EUR/USD started a decent increase after forming a base above the 1.1850 level. USD/JPY is declining and it broke the 109.00 support zone.
Important Takeaways for EUR/USD and USD/JPY
- The Euro is showing positive signs above the 1.1880 and 1.1900 levels.
- There was a break above a key declining channel with resistance near 1.1915 on the hourly chart of EUR/USD.
- USD/JPY started a fresh decline below the 109.20 and 109.00 support levels.
- There is a major bearish trend line forming with resistance near 109.50 on the hourly chart.
EUR/USD Technical Analysis
After a decent upward move, the Euro settled above the 1.1850 resistance zone against the US Dollar. Recently, the EUR/USD pair formed a support base above 1.1850 and started a fresh increase.
It broke a few important hurdles near the 1.1880 and 1.1900 levels. There was also a break above a key declining channel with resistance near 1.1915 on the hourly chart of EUR/USD. The pair gained pace above the 1.1940 level and settled above the 50 hourly simple moving average.
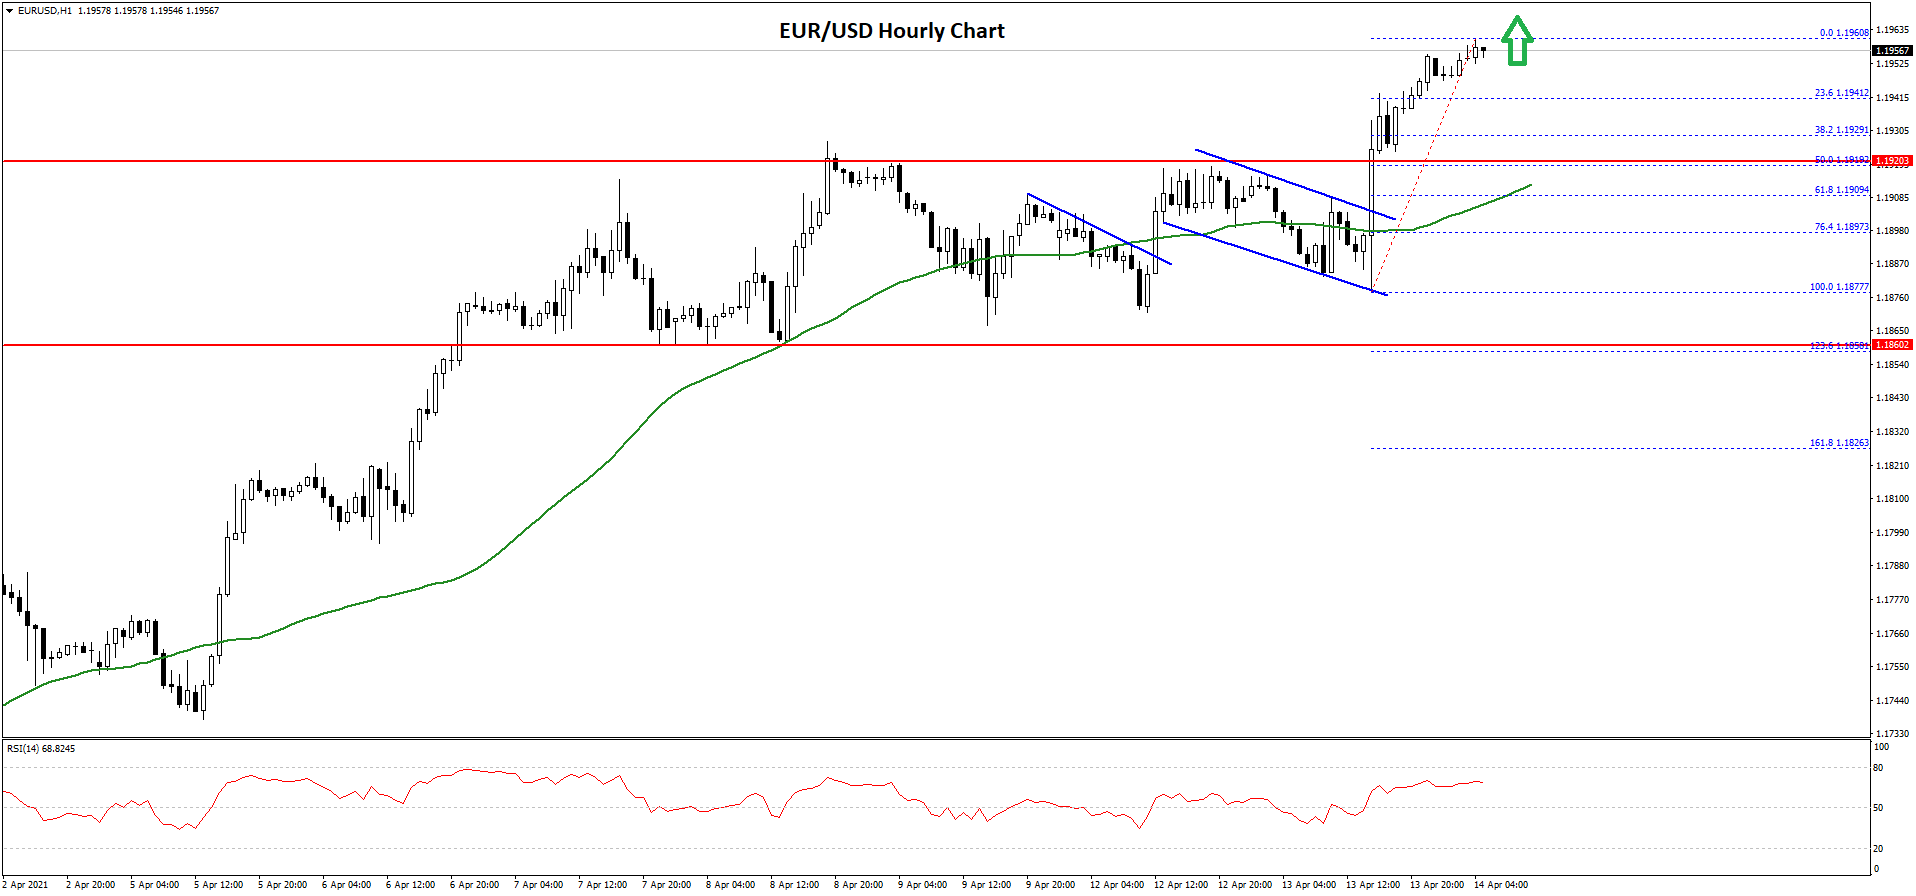
A high is formed near 1.1960 on FXOpen and the pair is now consolidating gains. An initial support on the downside is near the 1.1940 level.
The 23.6% Fib retracement level of the recent wave from the 1.1877 low to 1.1960 high is also near the 1.1940 level. The next major support on the downside is near the 1.1920 level (the recent breakout zone).
The 50% Fib retracement level of the recent wave from the 1.1877 low to 1.1960 high is also near the 1.1920 level. Any more losses might call for a test of the 1.1850 level. On the upside, the first major resistance is now forming near the 1.1960 levels.
A successful break above the 1.1960 resistance could open the doors for a push towards the 1.2000 resistance zone in the coming sessions.
USD/JPY Technical Analysis
The US Dollar failed to stay above the 109.80 level against the Japanese Yen. As a result, the USD/JPY pair started a fresh decline below the 109.50 support zone.
There was also a break below the 109.20 support level. The pair even broke the 109.00 support level and settled below the 50 hourly simple moving average. A low is formed near 108.75 and the pair is now correcting higher.
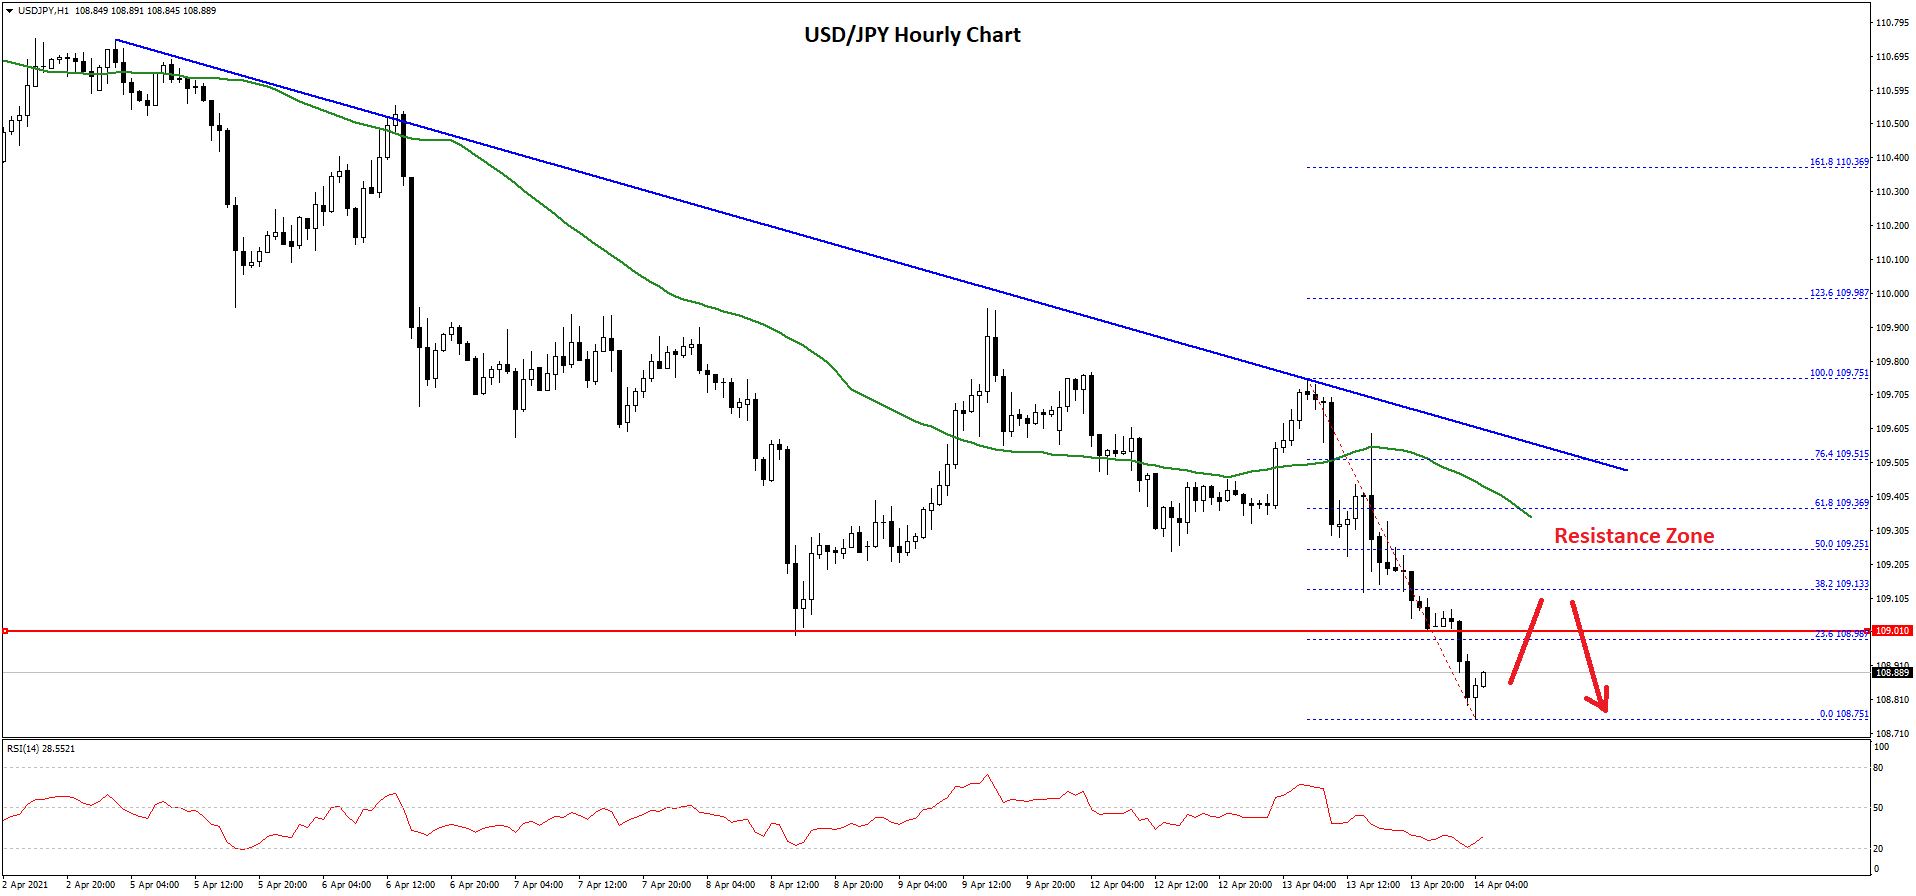
An initial resistance on the upside is near the 109.00 level. It is near the 23.6% Fib retracement level of the recent decline from the 109.75 high to 108.75 low.
There is also a major bearish trend line forming with resistance near 109.50 on the hourly chart. An intermediate resistance is near the 109.25 level and the 50 hourly simple moving average. The 50% Fib retracement level of the recent decline from the 109.75 high to 108.75 low is also near 109.25.
If the pair breaks the 109.00 and 109.25 resistance levels, it could even clear the trend line to continue higher. In the stated case, the USD/JPY pair might rise steadily towards the 109.75 level. Conversely, it might start a fresh decline below 108.75.
The next major support is near the 108.50 level. Any more losses might call for a move towards the 108.00 support zone in the near term.
This forecast represents FXOpen Markets Limited opinion only, it should not be construed as an offer, invitation or recommendation in respect to FXOpen Markets Limited products and services or as financial advice.
Trade over 50 forex markets 24 hours a day with FXOpen. Take advantage of low commissions, deep liquidity, and spreads from 0.0 pips. Open your FXOpen account now or learn more about trading forex with FXOpen.
This article represents the opinion of the Companies operating under the FXOpen brand only. It is not to be construed as an offer, solicitation, or recommendation with respect to products and services provided by the Companies operating under the FXOpen brand, nor is it to be considered financial advice.
Latest from Forex Analysis
Latest articles

Bitcoin Price Hits a Month's High, Breaking Key Resistance
Yesterday's release of CPI figures suggests that inflation is slowing down and a rate cut could be on the horizon. This weakened the dollar and boosted the value of assets priced in dollars, including BTC/USD.
As a result, the

The US Dollar Is Weakening Following Inflation Data
Yesterday saw the release of key economic indicators for the US. According to ForexFactory:
→ Core Price Index (CPI) monthly: actual = 0.3%, expected = 0.4%, previous = 0.4%;
→ Core Price Index (CPI) annual: actual = 3.4%, expected = 3.4%, previous

Analytical XRP Price Forecasts: What Are the Expectations for 2024-2030?
As XRP navigates the volatility and uncertainty of digital currencies, its price trajectory remains a subject of keen interest and speculation. This article delves into the historical price movements, current challenges, and future potential of XRP, offering various analytical predictions