


FXOpen

EUR/USD started an upside correction from the 1.0780 support area and recovered above 1.0820. USD/JPY is currently declining, but it is approaching a key support near 109.80.
Important Takeaways for EUR/USD and USD/JPY
- The Euro found support near 1.0780 and 1.0785, and recently recovered nicely.
- There is a key bullish trend line forming with support near 1.0855 on the hourly chart of EUR/USD.
- USD/JPY started a major decline and traded below the 111.00 and 110.50 support levels.
- There is a major bearish trend line forming with resistance near 110.60 on the hourly chart.
EUR/USD Technical Analysis
After a major decline, the Euro found support near the 1.0780 and 1.0785 levels against the US Dollar. As a result, the EUR/USD pair started a decent upward move and recovered above the 1.0820 resistance.
Moreover, there was a close above the 1.0840 and the 50 hourly simple moving average. Finally, the pair climbed above the 1.0875 level and traded as high as 1.0890 on FXOpen.
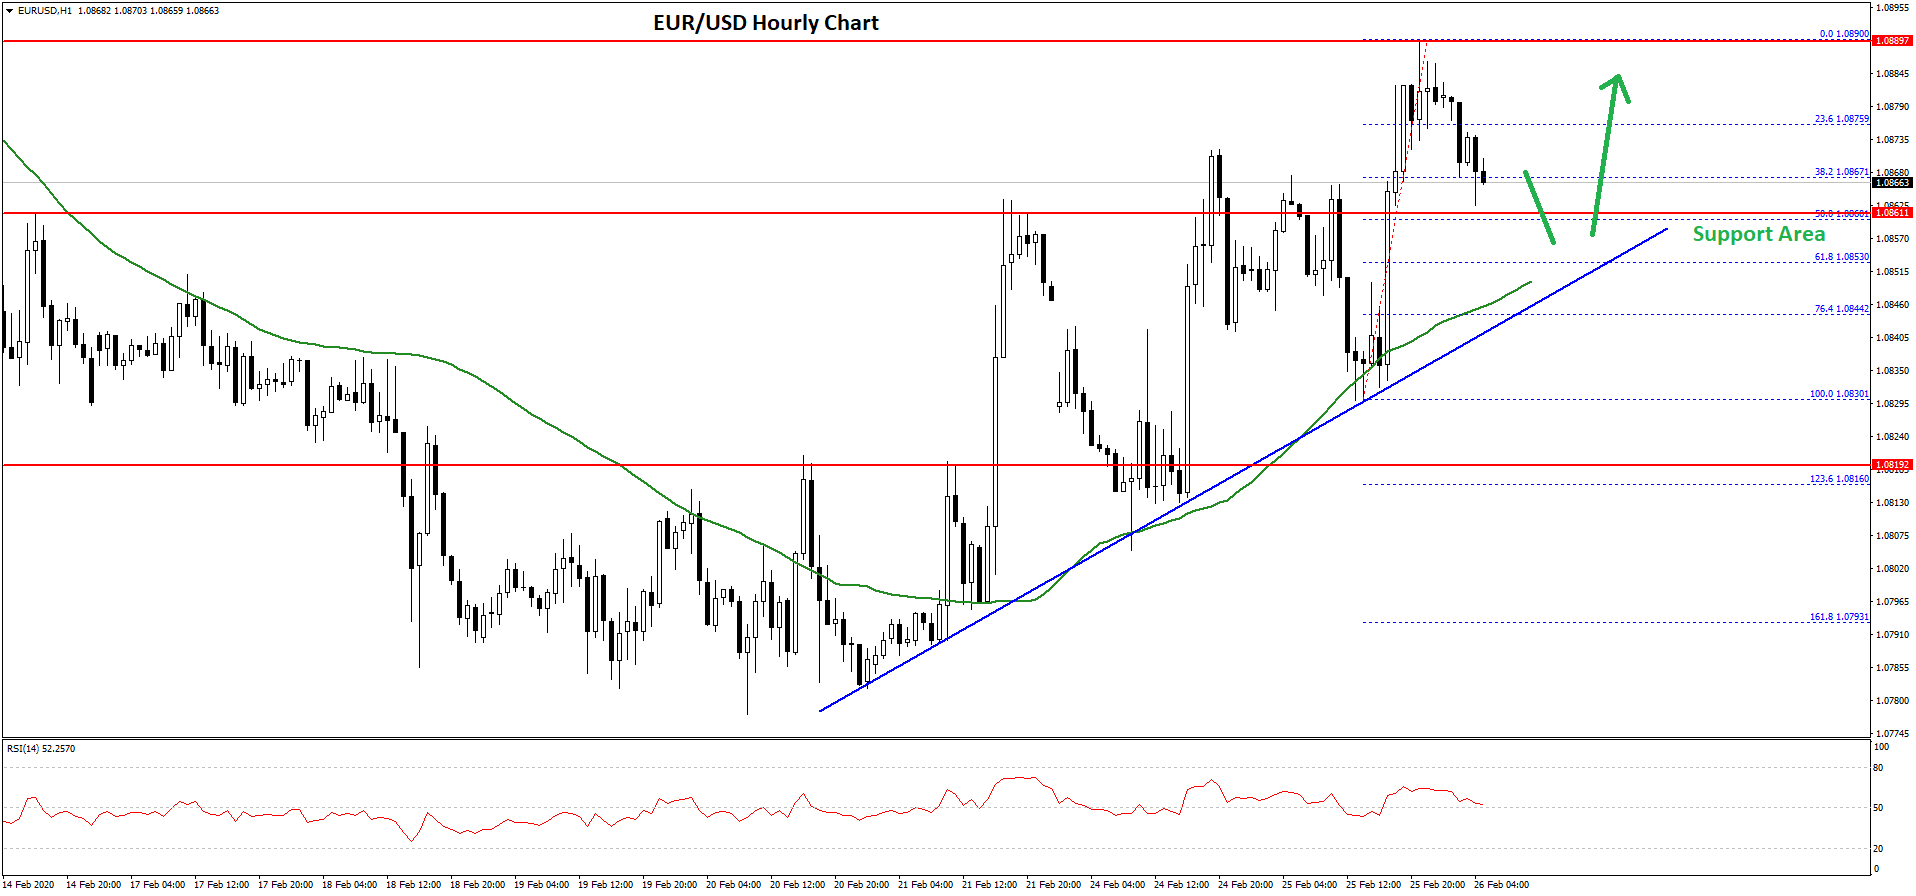
It is currently correcting lower and trading below the 1.0875 level. Besides, there was a break below the 23.6% Fib retracement level of the upward move from the 1.0830 low to 1.0890 high.
However, there are many supports on the downside, starting with 1.0860. More importantly, there is a key bullish trend line forming with support near 1.0855 on the hourly chart of EUR/USD.
The 50% Fib retracement level of the upward move from the 1.0830 low to 1.0890 high is also near the 1.0860 level to provide support. Therefore, dips in EUR/USD are likely to remain supported.
Any further losses could push the pair back into a bearish zone towards the 1.0820 and 1.0800 support levels. Conversely, the pair could bounce back from 1.0860 or 1.0850.
On the upside, an initial resistance is near the 1.0880 level. A clear break above the 1.0880 and 1.0900 levels could open the doors for a larger recovery towards the 1.0950 level.
USD/JPY Technical Analysis
The US Dollar topped near the 112.30 level and started a major decline against the Japanese Yen. The USD/JPY pair broke a couple of key supports near 111.00 to start a bearish wave.
The decline was such that the pair broke the 110.50 support and the 50 hourly simple moving average. Finally, the pair spiked below the 110.00 level and traded as low as 109.88.
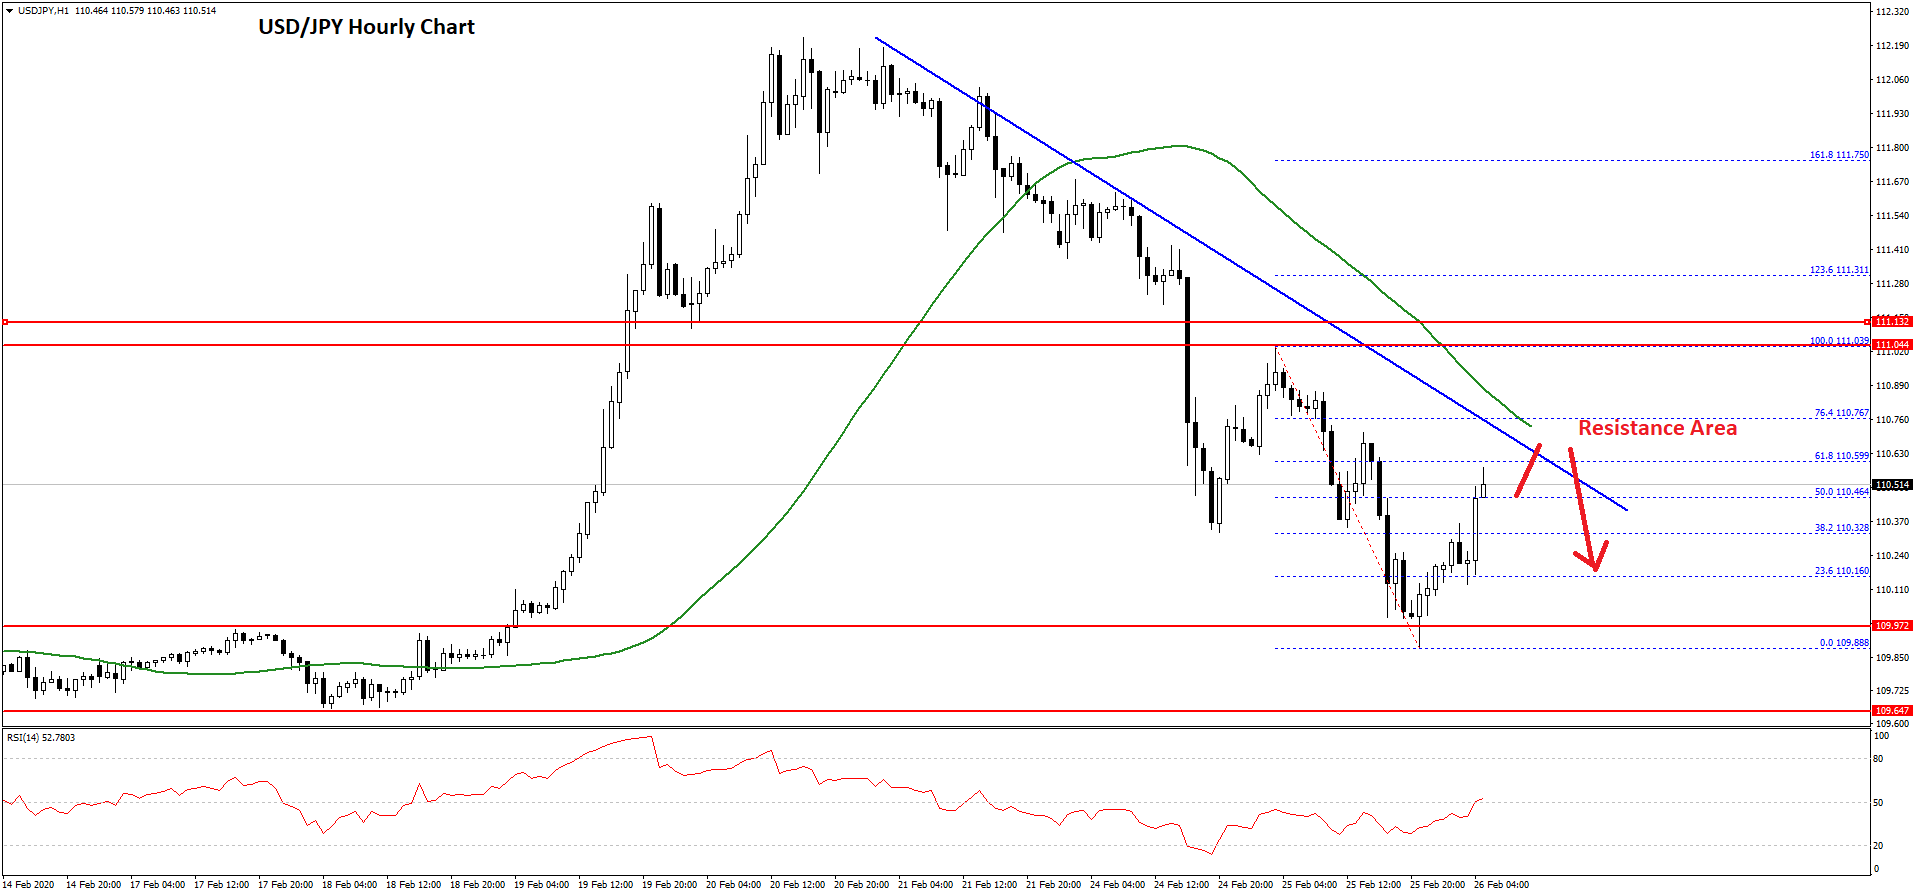
Recently, it started an upside correction above the 110.20 level. Besides, the pair broke the 50% Fib retracement level of the downward move from the 111.03 high to 109.88 low.
On the upside, there are a few key hurdles visible near the 110.60 level. Moreover, there is a major bearish trend line forming with resistance near 110.60 on the hourly chart.
The trend line is close to the 61.8% Fib retracement level of the downward move from the 111.03 high to 109.88 low. Above the trend line, the 50 hourly simple moving average is positioned near the 110.75 level.
Therefore, a clear break above the 110.75 and 110.80 levels won’t be easy. The next key resistance is near the 111.00 area (the previous support).
On the other hand, the USD/JPY pair might start another decline from 110.60. However, there are a few key supports on the downside near the 109.80 level, where the bulls might emerge.
Trade over 50 forex markets 24 hours a day with FXOpen. Take advantage of low commissions, deep liquidity, and spreads from 0.0 pips. Open your FXOpen account now or learn more about trading forex with FXOpen.
This article represents the opinion of the Companies operating under the FXOpen brand only. It is not to be construed as an offer, solicitation, or recommendation with respect to products and services provided by the Companies operating under the FXOpen brand, nor is it to be considered financial advice.
Latest from Forex Analysis
Latest articles

AUD/USD Rises Sharply on Inflation News
The Consumer Price Index for Australia was released this morning. According to ForexFactory:
→ CPI in quarterly terms: actual = 1.0%, expected = 0.8%, previous value = 0.6%;
→ CPI in annual terms: actual = 3.5%, expected = 3.4%, previous value = 3.

TSLA Share Price Up About 13% Despite Disappointing Report
Yesterday, TSLA trading closed at USD 144.68 per share, after which Tesla reported its results for the 1st quarter:
→ earnings per share: actual = USD 0.45, forecast = USD 0.49;
→ gross income: actual = USD 21.45 billion, forecast = USD

Market Analysis: Gold Price Corrects Gains While Oil Price Regains Strength
Gold price rallied above $2,400 before correcting lower. Crude oil price is rising and it could climb further higher toward the $85.50 resistance.
Important Takeaways for Gold and Oil Prices Analysis Today
· Gold price rallied significantly above $2,