


FXOpen

EUR/USD started a major decline and it traded below 1.1800. USD/JPY is attempting an upside break above the 110.00 resistance zone.
Important Takeaways for EUR/USD and USD/JPY
- The Euro is facing an increase in selling pressure below the 1.1800 level.
- There is a major bearish trend line forming with resistance near 1.1800 on the hourly chart of EUR/USD.
- USD/JPY started a fresh increase after it found support near the 109.10 zone.
- There is a key bearish trend line forming with resistance near 110.00 on the hourly chart.
EUR/USD Technical Analysis
After a close below 1.1850, the Euro started a major decline against the US Dollar. The EUR/USD pair gained bearish momentum and it broke the 1.1820 support zone.
The pair settled below the 1.1800 level and the 50 hourly simple moving average. It traded as low as 1.1755 on FXOpen and the pair is still showing a lot of bearish signs. Recently, there was a minor upside correction above 1.1770.
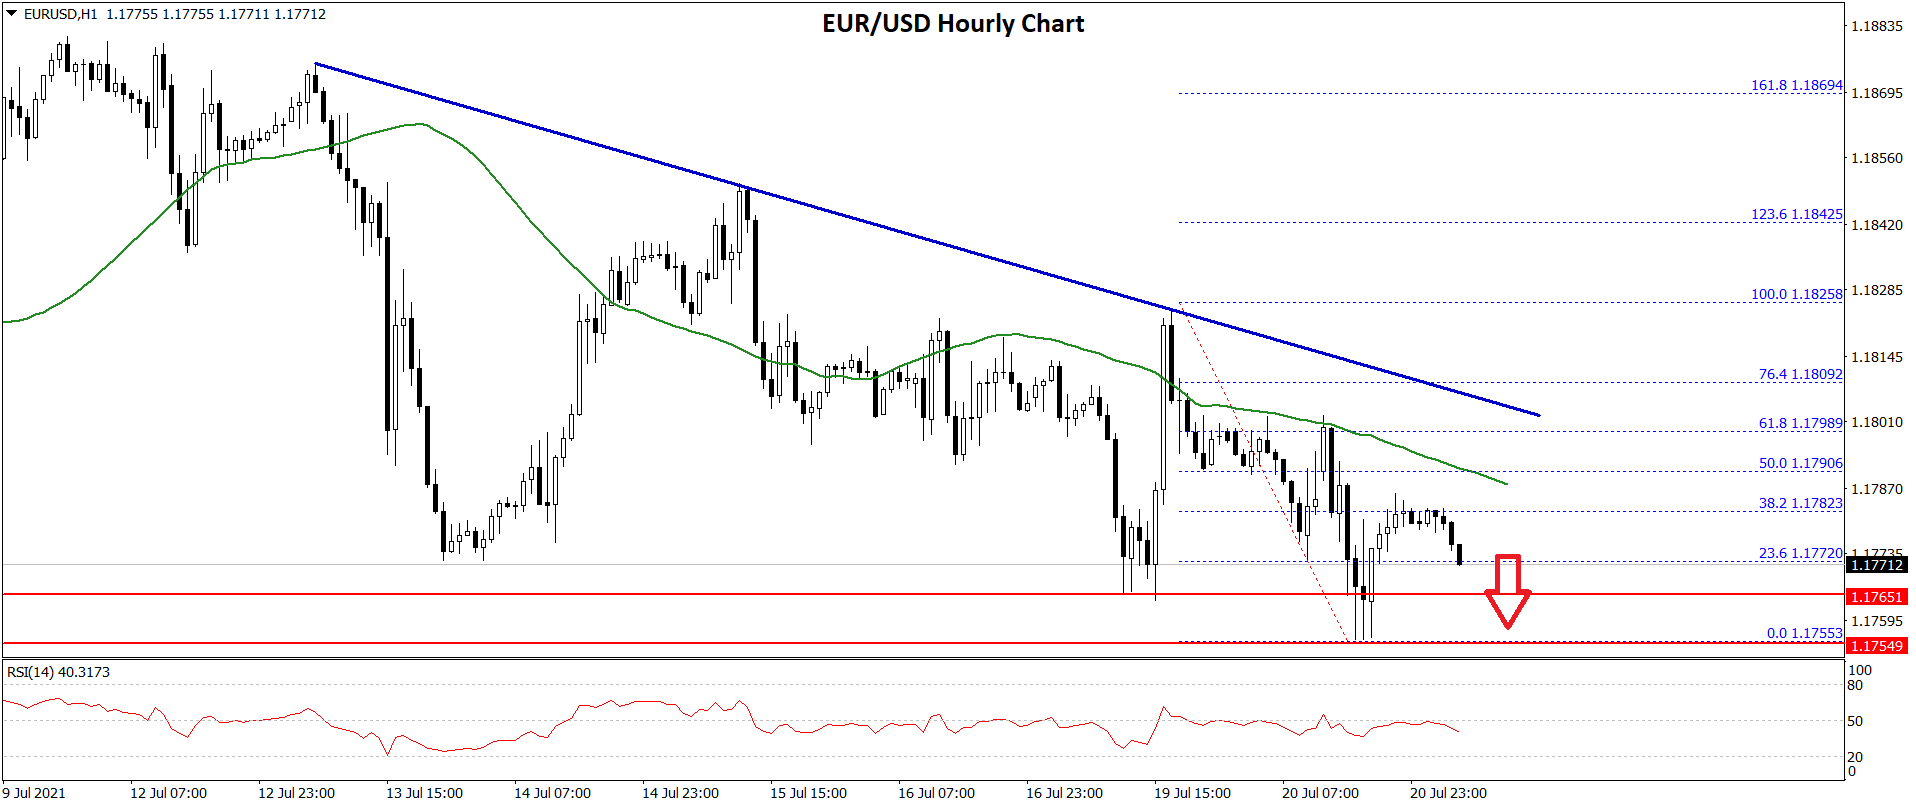
The pair surpassed the 23.6% Fib retracement level of the recent decline from the 1.1825 high to 1.1755 low. It is now facing resistance near the 1.1780 level.
The first key resistance is 1.1790 zone and the 50 hourly simple moving average. It is close to the 50% Fib retracement level of the recent decline from the 1.1825 high to 1.1755 low. There is also a major bearish trend line forming with resistance near 1.1800 on the hourly chart of EUR/USD.
A close above 1.1780 and 1.1800 could open the doors for a steady increase. If not, the pair might continue to move down below 1.1765. An intermediate support is near the 1.1755 level.
The next major support is near the 1.1750 level, below which the pair could drop towards the 1.1700 support in the near term.
USD/JPY Technical Analysis
The US Dollar started a fresh increase from the 109.10 zone against the Japanese Yen. The USD/JPY pair broke the 109.50 and 109.65 resistance levels.
There was a proper break above the 50% Fib retracement level of the key decline from the 110.33 high to 109.06 swing low. The pair even settled above the 110.50 level and the 50 hourly simple moving average.
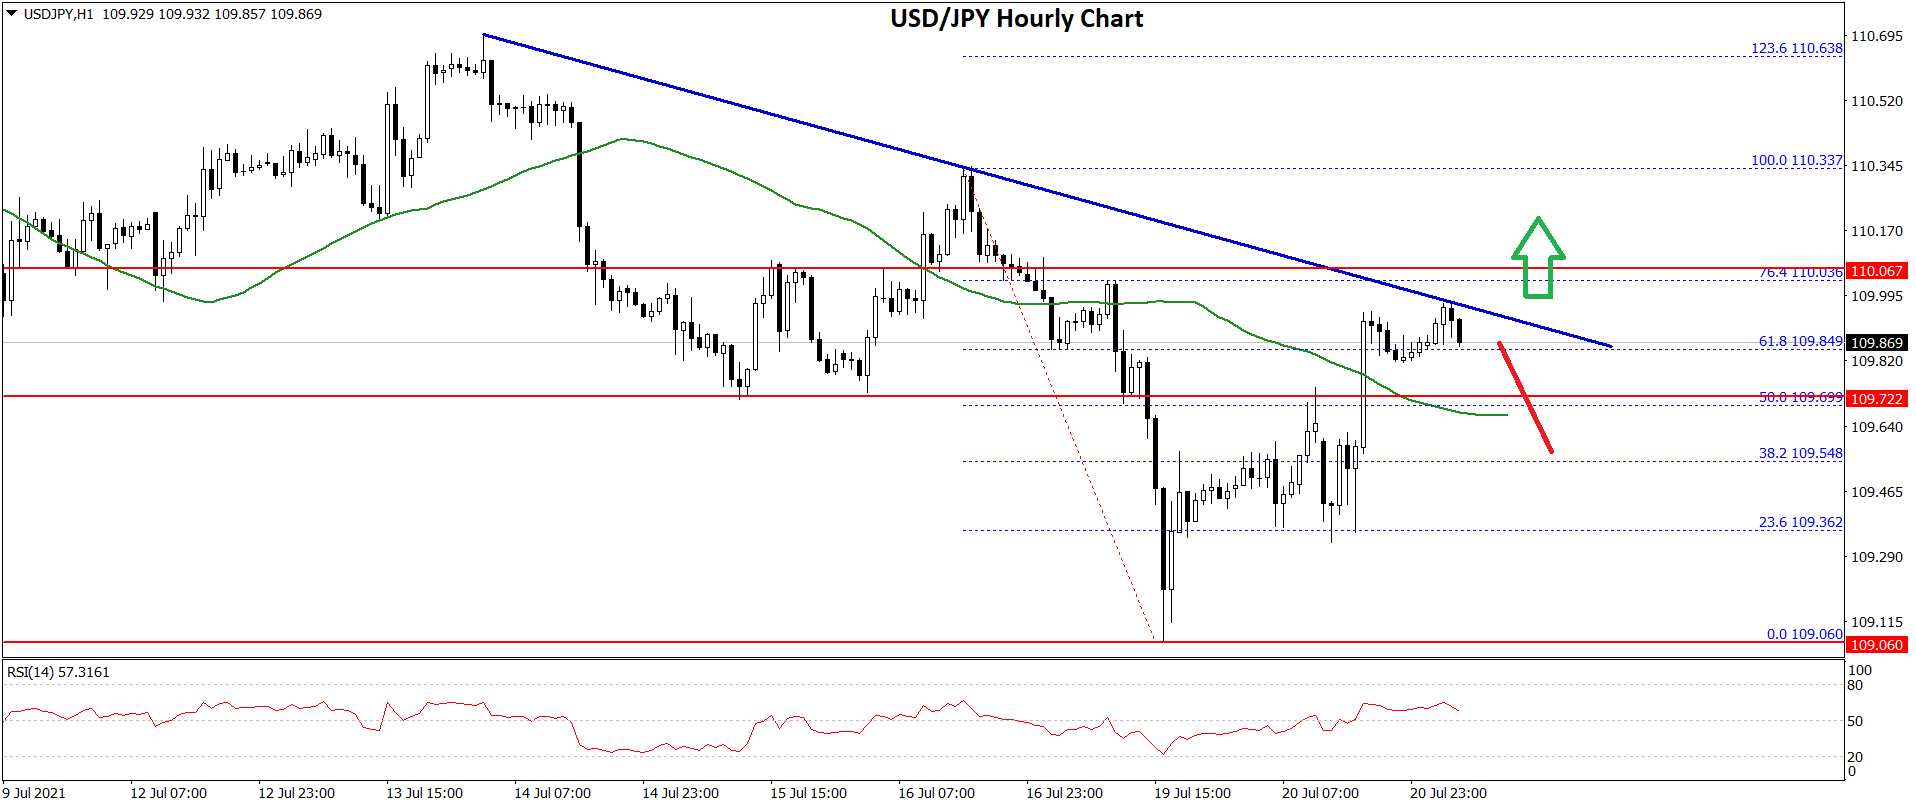
The pair is now facing resistance near the 110.00 level. There is also a key bearish trend line forming with resistance near 110.00 on the hourly chart.
The 76.4% Fib retracement level of the key decline from the 110.33 high to 109.06 swing low might also act as a resistance near 110.05. The next major resistance is near the 110.35 level, above which the pair is likely to rise steadily in the coming sessions.
In the stated case, the pair could test 111.00. An intermediate resistance could be near 110.80. On the downside, an immediate support is near the 109.75 level and the 50 hourly SMA.
The main support is near the 109.50 level. A downside break and close below 109.50 could open the doors for a fresh decline toward the 109.00 zone. The next major support could be 108.80, below which the USD/JPY pair might continue to move down towards the 108.50 level in the near term.
This forecast represents FXOpen Markets Limited opinion only, it should not be construed as an offer, invitation or recommendation in respect to FXOpen Markets Limited products and services or as financial advice.
Trade over 50 forex markets 24 hours a day with FXOpen. Take advantage of low commissions, deep liquidity, and spreads from 0.0 pips. Open your FXOpen account now or learn more about trading forex with FXOpen.
This article represents the opinion of the Companies operating under the FXOpen brand only. It is not to be construed as an offer, solicitation, or recommendation with respect to products and services provided by the Companies operating under the FXOpen brand, nor is it to be considered financial advice.
Latest from Forex Analysis
Latest articles

Google Share Price Rose Post-market to a New All-time Record
Yesterday, after the close of the main trading session, a report on activities for the 1st quarter of Alphabet Inc. (Google's parent company) was published. The report was strong, exceeding investors' expectations.
→ Quarterly EPS = USD 1.89 (expected = USD 1.

S&P 500 Rebounds after Negative GDP News
Data released yesterday showed US GDP growth slowed to 1.6% in the first quarter of the year. According to ForexFactory: forecast = 2.2%, past value = 2.4%.
Reaction to the news sent the S&P 500 mini stock

GBP/USD And USD/CAD Daily Chart Outlook
GBP/USD is attempting a recovery wave from 1.2300. USD/CAD is consolidating and might aim for a move above the 1.3760 resistance zone.
Important Takeaways for GBP/USD and USD/CAD Analysis Today
· The British Pound started