


FXOpen

EUR/USD is showing a few positive signs above the 1.0920 and 1.0955 support levels. Conversely, USD/JPY is declining and it remains at a risk of more losses below 107.00.
Important Takeaways for EUR/USD and USD/JPY
- The Euro recovered nicely after forming a support base above the 1.0855 level.
- There is a key bullish trend line forming with support near 1.0940 on the hourly chart of EUR/USD.
- USD/JPY started a major decline after it failed to clear the 109.20 resistance area.
- There is a crucial bearish trend line forming with resistance near 107.55 on the hourly chart.
EUR/USD Technical Analysis
In the past few days, the Euro started a decent recovery above the 1.0800 barrier against the US Dollar. The EUR/USD pair broke many key hurdles near the 1.0855 and 1.0860 levels to move into a positive zone.
The bulls remained in action, leading the pair above the 1.0920 resistance and the 50 hourly simple moving average. Finally, the pair broke the 1.0950 resistance and traded as high as 1.0989 on FXOpen.
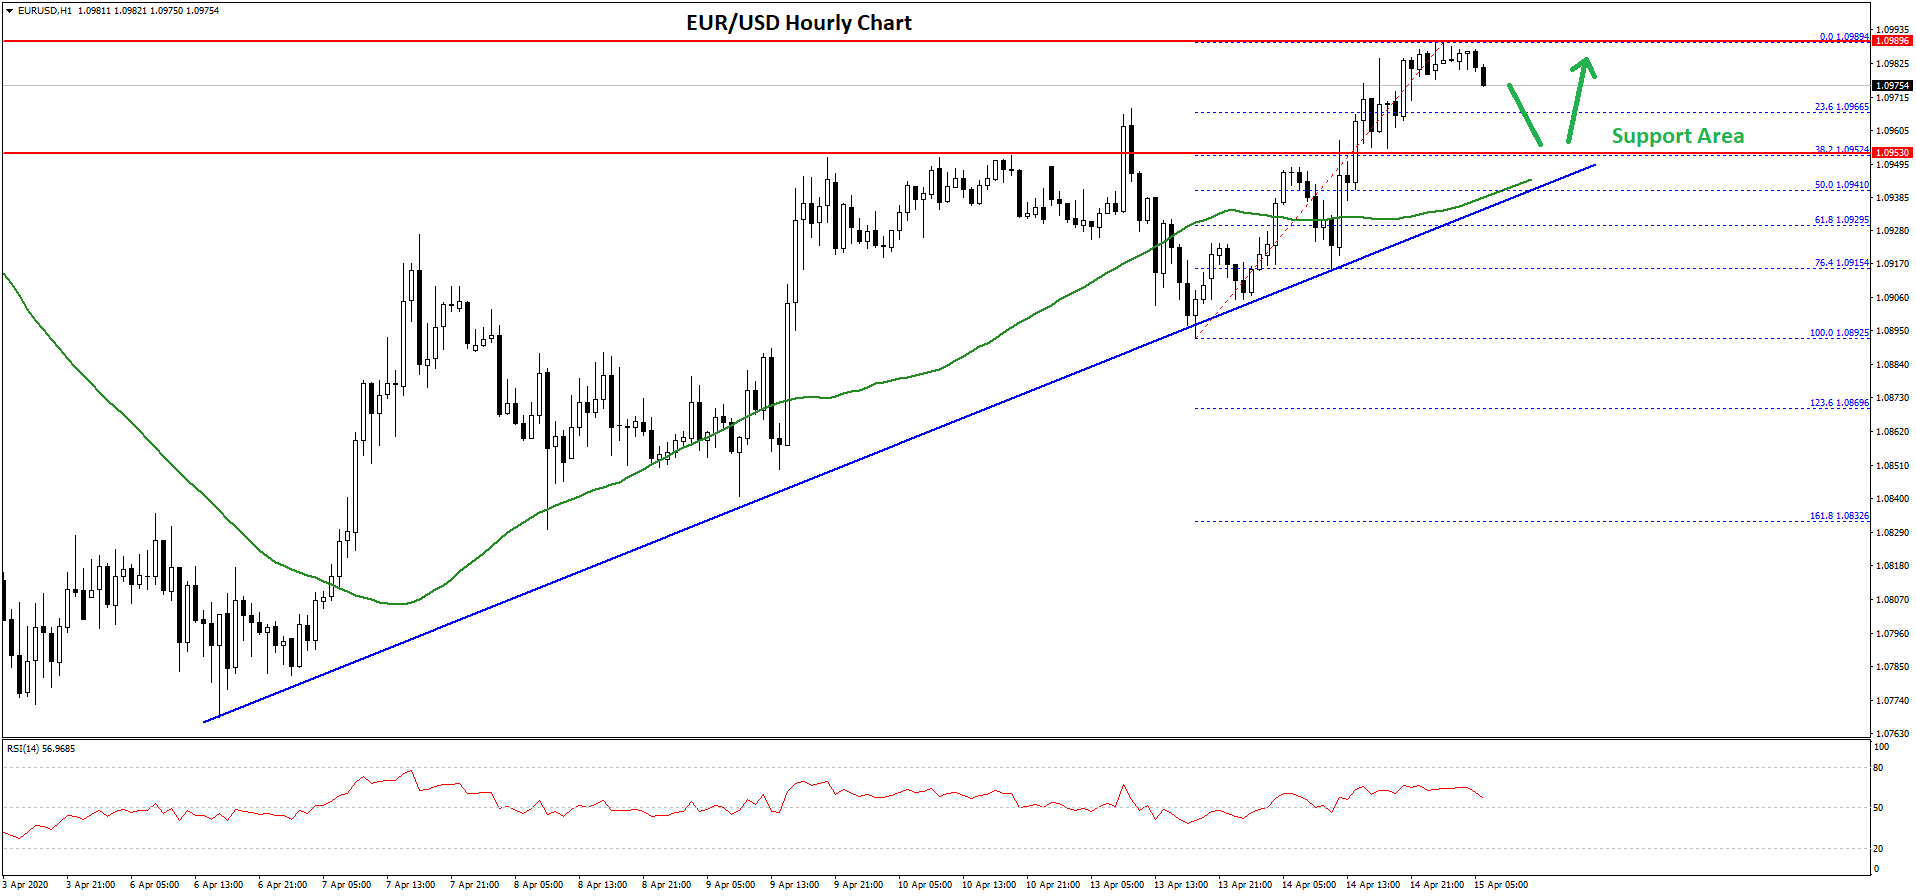
It is currently correcting lower and trading near the 1.0980 level. An initial support is near the 1.0965 level. It is close to the 23.6% Fib retracement level of the recent rise from the 1.0892 low to 1.0989 high.
The first major support on the downside is near the 1.0955 level (the recent breakout zone). There is also a key bullish trend line forming with support near 1.0940 on the hourly chart of EUR/USD.
The trend line is near the 50% Fib retracement level of the recent rise from the 1.0892 low to 1.0989 high. Therefore, the 1.0955 and 1.0940 levels are important supports in the near term.
If there is a downside break below the trend line, the pair could correct back towards the 1.0920 and 1.0880 levels. On the upside, an initial resistance is near the 1.0990 and 1.1000 levels.
A successful close above the 1.1000 resistance level may perhaps start a strong upward move towards 1.1050 and 1.1080 in the near term.
USD/JPY Technical Analysis
The US Dollar failed to gain strength above 109.00 and started a fresh decline against the Japanese Yen. The USD/JPY pair followed a bearish path and traded below the key 108.00 support area.
The bears remained in action and pushed the pair below the 107.50 support and the 50 hourly simple moving average. The pair traded to a new weekly low at 106.94 and it is currently consolidating losses.
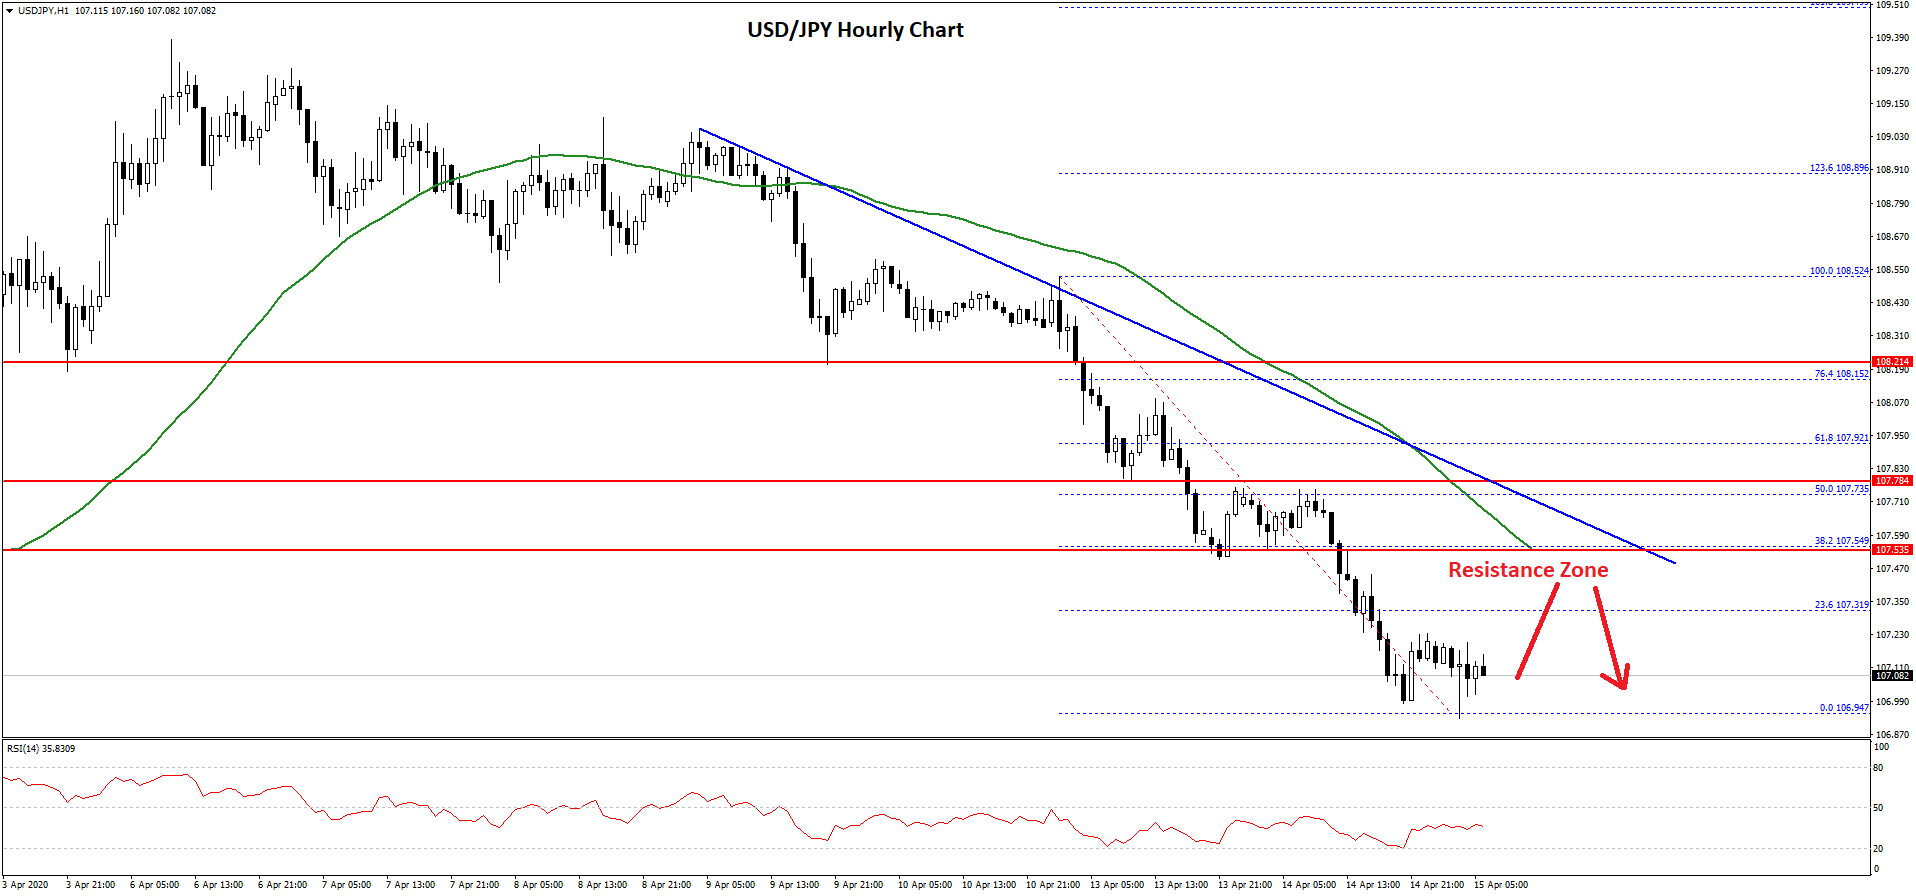
An initial hurdle on the upside is near the 107.30 level since it is close to the 23.6% Fib retracement level of the recent decline from the 108.52 high to 106.94 low.
The first major resistance on the upside is near the 107.50 level and the 50 hourly simple moving average. Moreover, there is a crucial bearish trend line forming with resistance near 107.55 on the hourly chart.
Above the trend line, the next resistance is near 107.75 and the 50% Fib retracement level of the recent decline from the 108.52 high to 106.94 low.
Therefore, the USD/JPY pair is likely to remain in a downtrend as long as it is trading below the 107.50 and 107.75 resistance levels. On the downside, a close below 107.00 could lead the pair towards 106.40 or 106.20 in the coming sessions.
Trade over 50 forex markets 24 hours a day with FXOpen. Take advantage of low commissions, deep liquidity, and spreads from 0.0 pips. Open your FXOpen account now or learn more about trading forex with FXOpen.
This article represents the opinion of the Companies operating under the FXOpen brand only. It is not to be construed as an offer, solicitation, or recommendation with respect to products and services provided by the Companies operating under the FXOpen brand, nor is it to be considered financial advice.
Latest from Forex Analysis
Latest articles

Google Share Price Rose Post-market to a New All-time Record
Yesterday, after the close of the main trading session, a report on activities for the 1st quarter of Alphabet Inc. (Google's parent company) was published. The report was strong, exceeding investors' expectations.
→ Quarterly EPS = USD 1.89 (expected = USD 1.

S&P 500 Rebounds after Negative GDP News
Data released yesterday showed US GDP growth slowed to 1.6% in the first quarter of the year. According to ForexFactory: forecast = 2.2%, past value = 2.4%.
Reaction to the news sent the S&P 500 mini stock

GBP/USD And USD/CAD Daily Chart Outlook
GBP/USD is attempting a recovery wave from 1.2300. USD/CAD is consolidating and might aim for a move above the 1.3760 resistance zone.
Important Takeaways for GBP/USD and USD/CAD Analysis Today
· The British Pound started