


FXOpen
EUR/USD found support near 1.1215 and started a short term correction. USD/JPY remains in an uptrend above the 113.70 support and resistance awaits near 114.10.
Important Takeaways for EUR/USD and USD/JPY
- The Euro declined heavily below 1.1300 until buyers appeared near the 1.1215 level.
- There was a break above a key bearish trend line with resistance at 1.1280 on the hourly chart of EUR/USD.
- USD/JPY settled above the 113.50 and 113.70 resistance levels.
- The pair is holding an important bullish trend line with support at 113.80 on the hourly chart.
EUR/USD Technical Analysis
The Euro started a major downside move from the 1.1500 resistance area against the US Dollar. The EUR/USD pair broke the 1.1440 and 1.1350 support levels to register nasty declines.
The pair even broke the 1.1280 support and settled below the 50 hourly simple moving average. Sellers pushed the pair close to the 1.1200 support area and formed a low at 1.1215. Later, the pair started an upside correction and recovered above the 1.1250 resistance.
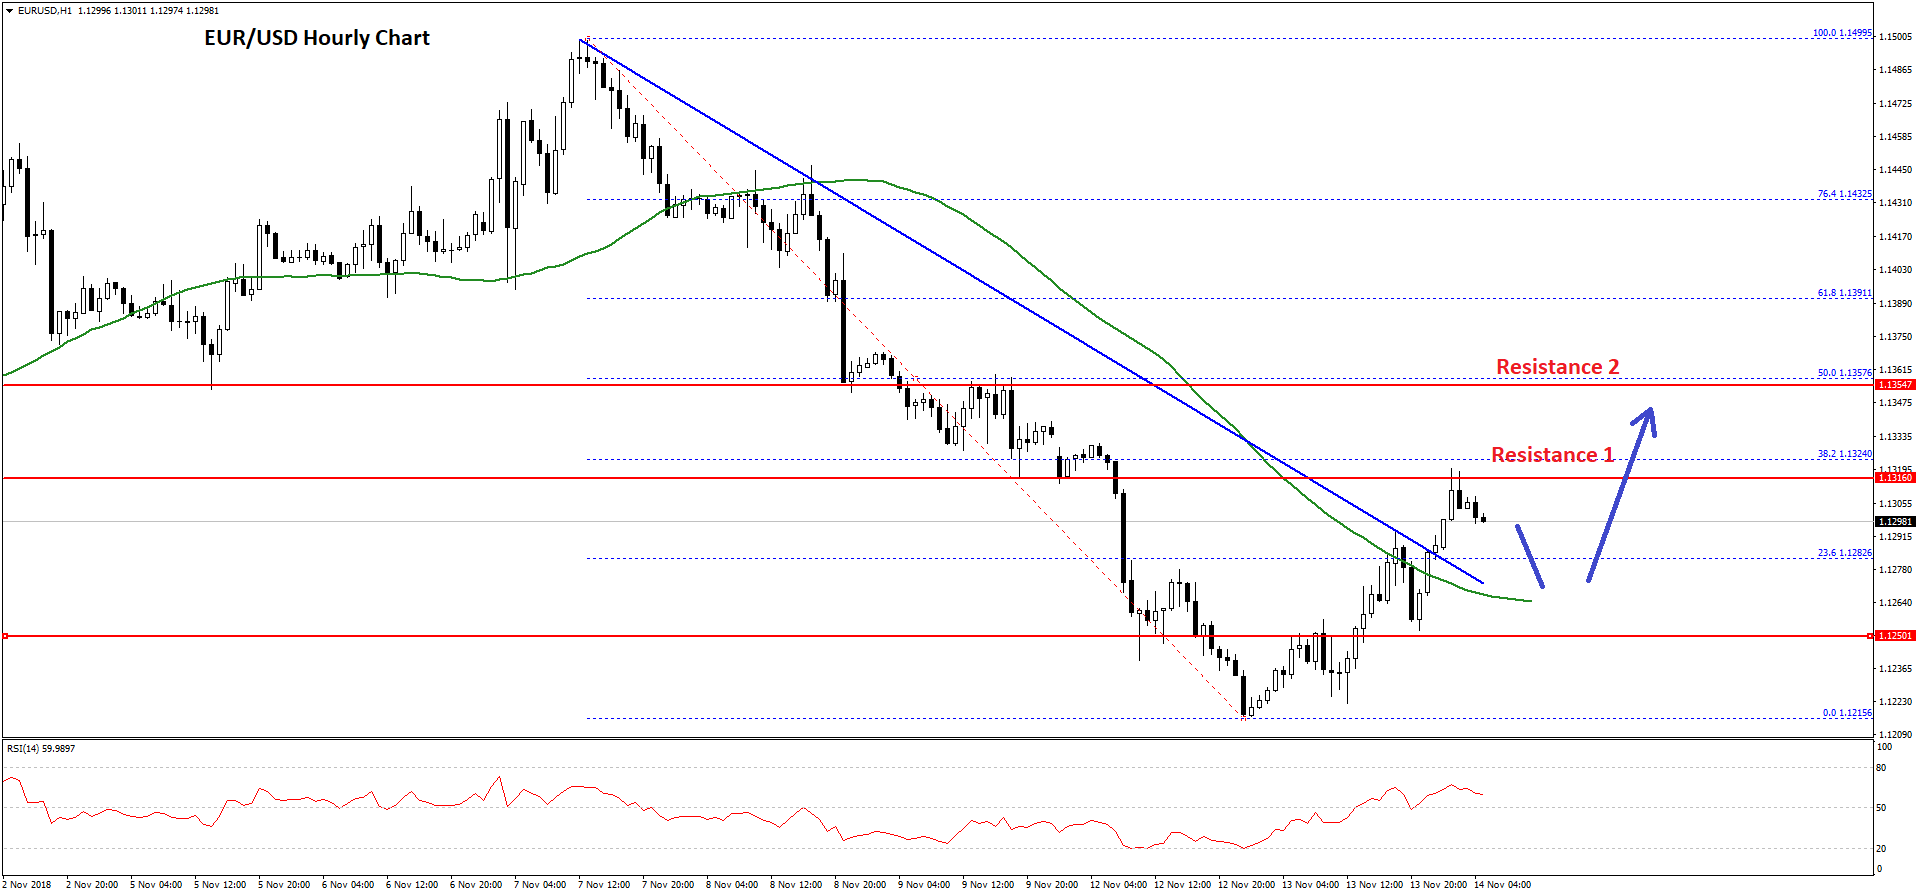
During the recovery, the pair moved above the 23.6% Fib retracement level of the last decline from the 1.1499 high to 1.1215 low. Moreover, there was a break above a key bearish trend line with resistance at 1.1280 on the hourly chart.
The pair traded above the 1.1280 resistance and the 50 hourly simple moving average. However the upside move was capped by the 1.1320 resistance area, which was a support earlier.
The pair is currently consolidating near 1.1300 and it seems like there could be a minor downside correction before the pair resumes its recovery. An initial support on the downside awaits near 1.1285, below which EUR/USD could test the 1.1265 level and the 50 hourly SMA.
On the upside, the pair must break the 1.1320 resistance to resume its recovery. The next major resistance awaits near 1.1350 and the 50% Fib retracement level of the last decline from the 1.1499 high to 1.1215 low.
USD/JPY Technical Analysis
There were continuous gains in the US Dollar above the 113.00 support level against the Japanese Yen. The USD/JPY pair traded above the 113.50 and 113.70 resistance levels to move further into the bullish zone.
The upside move was such that the pair broke the 114.00 resistance and traded as high as 114.24. Later, there was a downside correction and the pair declined below the 114.00 level. However, the decline was protected by the 113.70 area, which was a resistance earlier and now it is acting as a support.
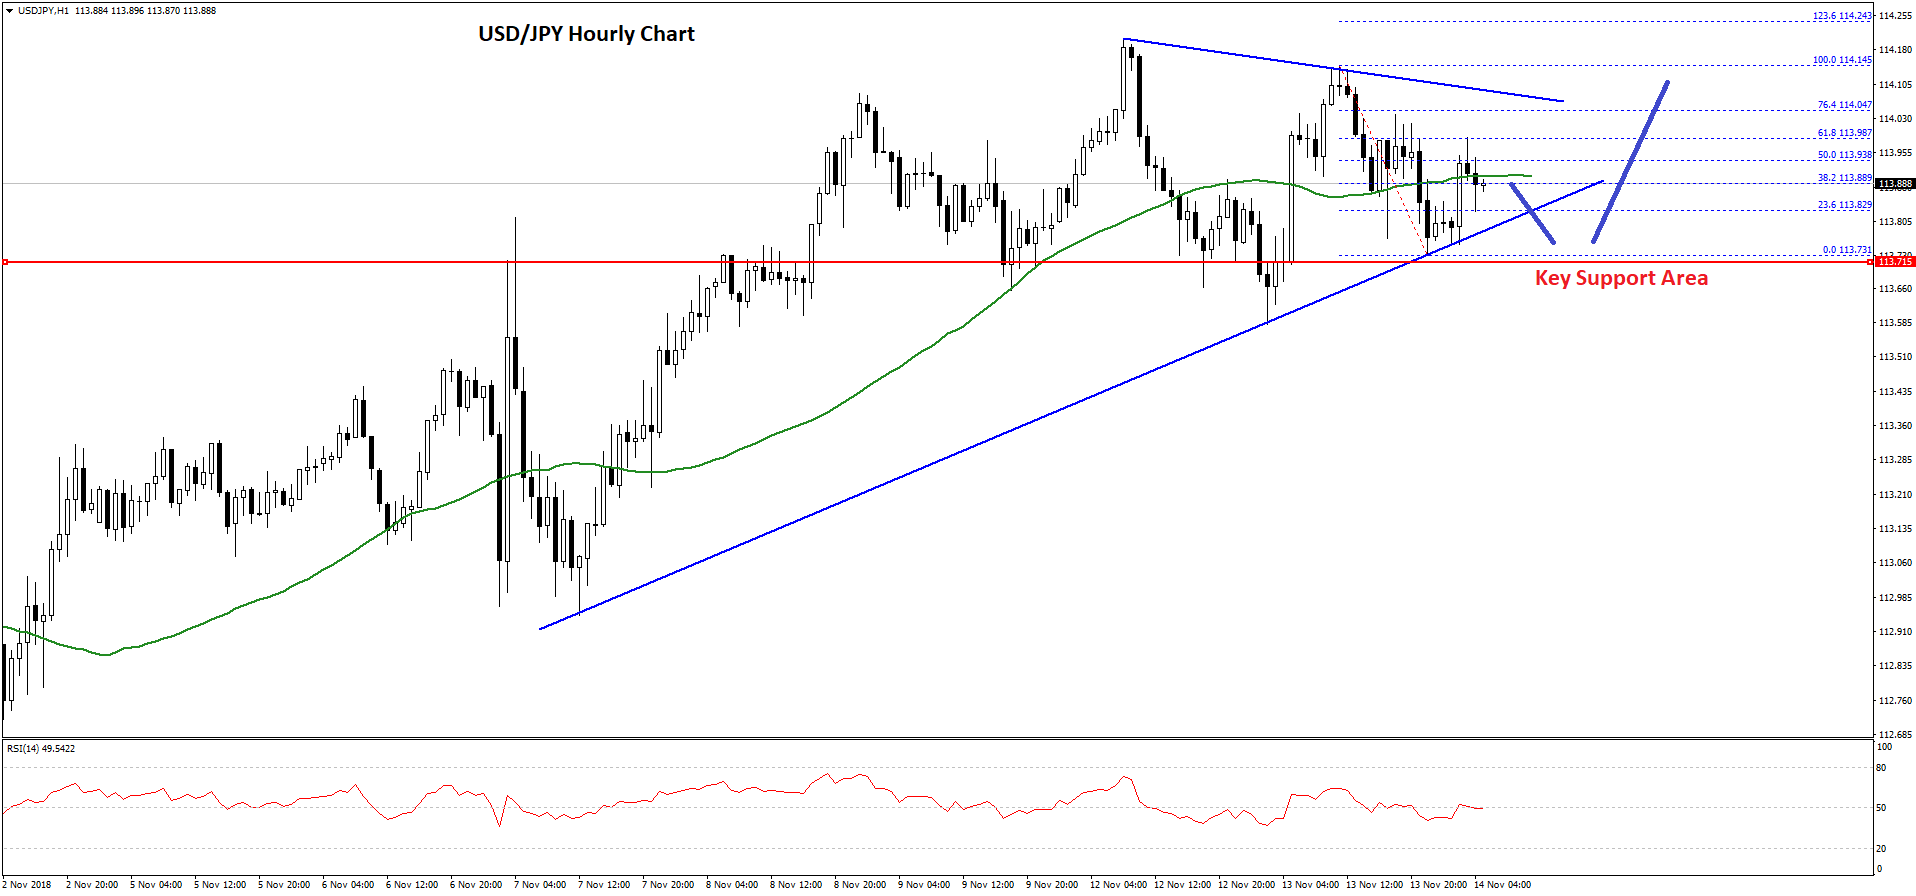
More importantly, there is an important bullish trend line with support at 113.80 on the hourly chart. The pair is currently moving higher towards the 61.8% Fib retracement level of the recent decline from the 114.15 high to 113.73 low.
It is currently trading above the 50 hourly simple moving average and 113.80, but it could face a solid resistance near the 114.05 and 114.10 levels. There is also a connecting bearish trend line at 114.10 on the same chart.
Therefore, a break above the trend line is needed for more gains above the 114.20 and 114.40 levels. Overall, it seems like USD/JPY may continue to consolidating above 113.70 before the next move. It will most likely climb higher towards 114.50 unless sellers push the pair below 113.70 and 113.50.
Trade over 50 forex markets 24 hours a day with FXOpen. Take advantage of low commissions, deep liquidity, and spreads from 0.0 pips. Open your FXOpen account now or learn more about trading forex with FXOpen.
This article represents the opinion of the Companies operating under the FXOpen brand only. It is not to be construed as an offer, solicitation, or recommendation with respect to products and services provided by the Companies operating under the FXOpen brand, nor is it to be considered financial advice.
Latest from Forex Analysis
Latest articles

Market Analysis: AUD/USD and NZD/USD Turn Red
AUD/USD declined below the 0.6500 and 0.6455 support levels. NZD/USD is also moving lower and might struggle to recover above 0.5950.
Important Takeaways for AUD/USD and NZD/USD Analysis Today
· The Aussie Dollar started

Since the Start of the Week, Brent Oil Price Has Dropped over 4%
At the beginning of the week, March 15, we wrote that the price of Brent oil could form a correction from the resistance level of USD 91 per barrel. Since then, the price has decreased by more than 4% due

Fair Value Gaps vs Liquidity Voids in Trading
Understanding fair value gaps and liquidity voids is essential for traders seeking to navigate the complexities of the financial markets. These concepts, deeply rooted in the Smart Money Concept (SMC), provide valuable insights into the dynamics of supply and demand,