


FXOpen
EUR/USD faced a solid resistance near 1.1425 and declined below 1.1325. USD/JPY traded higher recently and moved in a bullish zone above 113.20.
Important Takeaways for EUR/USD and USD/JPY
- The Euro failed to break the 1.1425-1.1440 resistance area and declined recently.
- There are two bearish trend lines in place with resistance at 1.1310 and 1.1355 on the hourly chart of EUR/USD.
- USD/JPY is currently gaining momentum above the 113.50 and 113.70 resistance levels.
- The pair is following an ascending channel with support at 113.70 on the hourly chart.
EUR/USD Technical Analysis
The Euro started a significant downside move from the 1.1450 swing high against the US Dollar. The EUR/USD pair failed to settle above the 1.1425 and 1.1440 resistance levels, resulting in a solid decline.
The pair traded lower recently and broke the 1.1400, 1.1340 and 1.1325 support levels. There was even a close below the 1.1325 support and the 50 hourly simple moving average. A new weekly low was formed at 1.1278 on FXOpen and later the pair started consolidating losses.
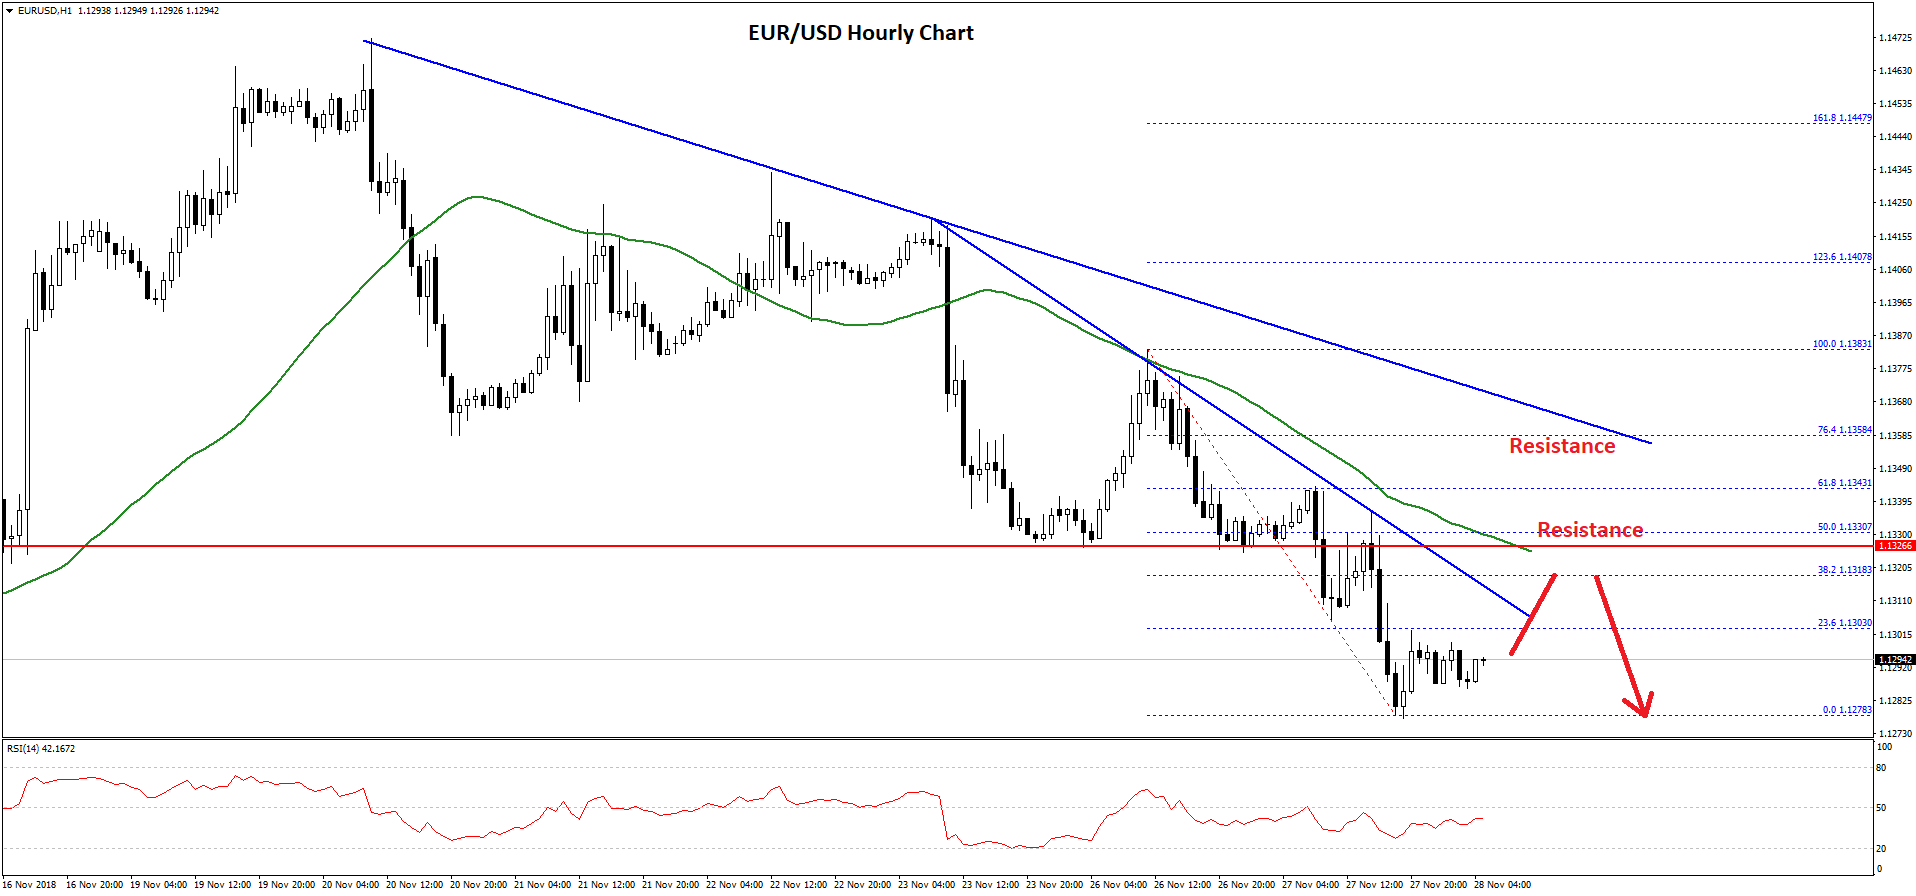
It tested the 23.6% Fib retracement level of the last decline from the 1.1383 high to 1.1278 low. On the upside, there are many resistances for buyers, starting with 1.1300 and up to 1.1360.
More importantly, there are two bearish trend lines in place with resistance at 1.1310 and 1.1355 on the hourly chart of EUR/USD. An intermediate resistance is near the 1.1330 level and the 50 hourly simple moving average.
Besides, the 50% Fib retracement level of the last decline from the 1.1383 high to 1.1278 low is also near 1.1330 to act as a solid resistance. Therefore, if the price corrects higher, it won’t be easy for buyers to clear the 1.1330 and 1.1355 resistance levels.
On the downside, an initial support is near the 1.1275 level, below which EUR/USD could decline towards the 1.1240 level in the near term.
USD/JPY Technical Analysis
The US Dollar remained in a decent uptrend from the 112.20 swing low and traded above the 113.00 resistance against the Japanese Yen. The USD/JPY pair traded above the 113.20 and 113.50 resistance levels to move into a positive zone.
During the upside, there was a close above the 113.50 level and the 50 hourly simple moving average. The pair recently traded towards the 113.80 level and a high was formed at 113.85. At the moment, the pair is consolidating gains above 113.75 and it remains well supported on the downside.
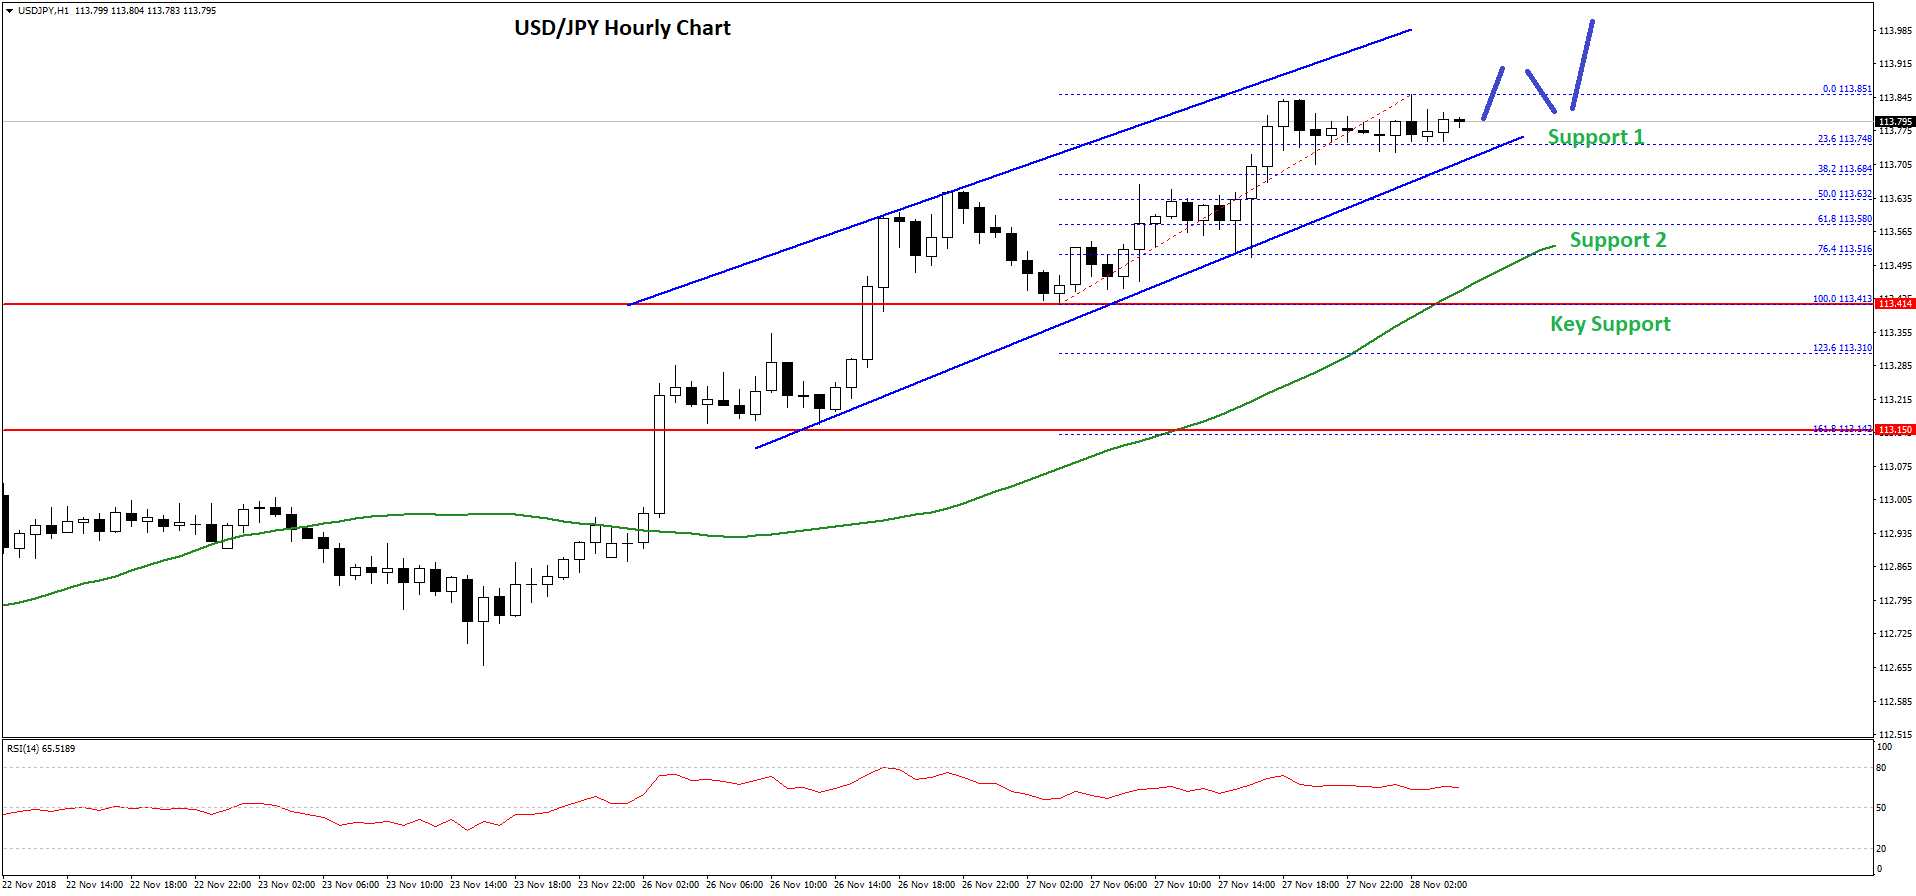
An initial support is near the 23.6% Fib retracement level of the recent wave from the 113.41 low to 113.85 high. Moreover, there is an ascending channel formed with support at 113.70 on the hourly chart.
Below the channel support, the next major support is at 113.60 and the 50% Fib retracement level of the recent wave from the 113.41 low to 113.85 high. The main support is at 113.40-50 zone and the 50 hourly SMA.
Therefore, if there is a downside correction, the pair could find support near the 113.70, 113.60 or 113.50 level. On the upside, a break above the 113.85 and 114.00 resistance levels may push USD/JPY towards the 114.50 level in the near term.
Trade over 50 forex markets 24 hours a day with FXOpen. Take advantage of low commissions, deep liquidity, and spreads from 0.0 pips. Open your FXOpen account now or learn more about trading forex with FXOpen.
This article represents the opinion of the Companies operating under the FXOpen brand only. It is not to be construed as an offer, solicitation, or recommendation with respect to products and services provided by the Companies operating under the FXOpen brand, nor is it to be considered financial advice.
Latest from Forex Analysis
Latest articles

Anchored VWAP and How You Can Use It in Forex Trading
In the world of forex trading, understanding the nuanced tools at your disposal can significantly enhance decision-making processes. One such sophisticated tool is the Anchored Volume-Weighted Average Price (Anchored VWAP), which refines the standard VWAP by allowing traders to set

META Share Price Collapses after Publication of Quarterly Report
Just yesterday, META's stock price closed at USD 493.50, up approximately 40% since the start of 2024 and up nearly 300% since the start of 2023.
However, following the release of Meta's quarterly report, its shares plummeted to USD

USD/JPY Analysis: The Rate Exceeds The Level of 155 Yen Per US Dollar
Today, the price of USD/JPY once again renewed its 34-year high, exceeding the level of 155 yen per dollar, which put pressure on the current authorities.
According to Reuters, officials are trying to maintain calm in the market.
"We