


FXOpen

EUR/USD failed to stay above 1.1250 and recently declined below 1.1200. USD/JPY is trading in a broad range and it could slide in the short term towards the 108.30 or 108.20 support.
Important Takeaways for EUR/USD and USD/JPY
- The Euro started a strong decline from well above the 1.1300 support area.
- There is a key bearish trend line in place with resistance near 1.1215 on the hourly chart of EUR/USD.
- USD/JPY is trading in a broad range with resistance near the 108.70 level.
- There is a short term bearish trend line forming with resistance near 108.60 on the hourly chart.
EUR/USD Technical Analysis
The Euro topped near the 1.1350 level and recently started a strong decline against the US Dollar. The EUR/USD pair broke the 1.1320 and 1.1300 support levels to enter a bearish zone.
Moreover, there was a close below the 1.1250 support level and the 50 hourly simple moving average. The pair even gained pace below the 1.1200 level and a new swing low was formed at 1.1181 on FXOpen.
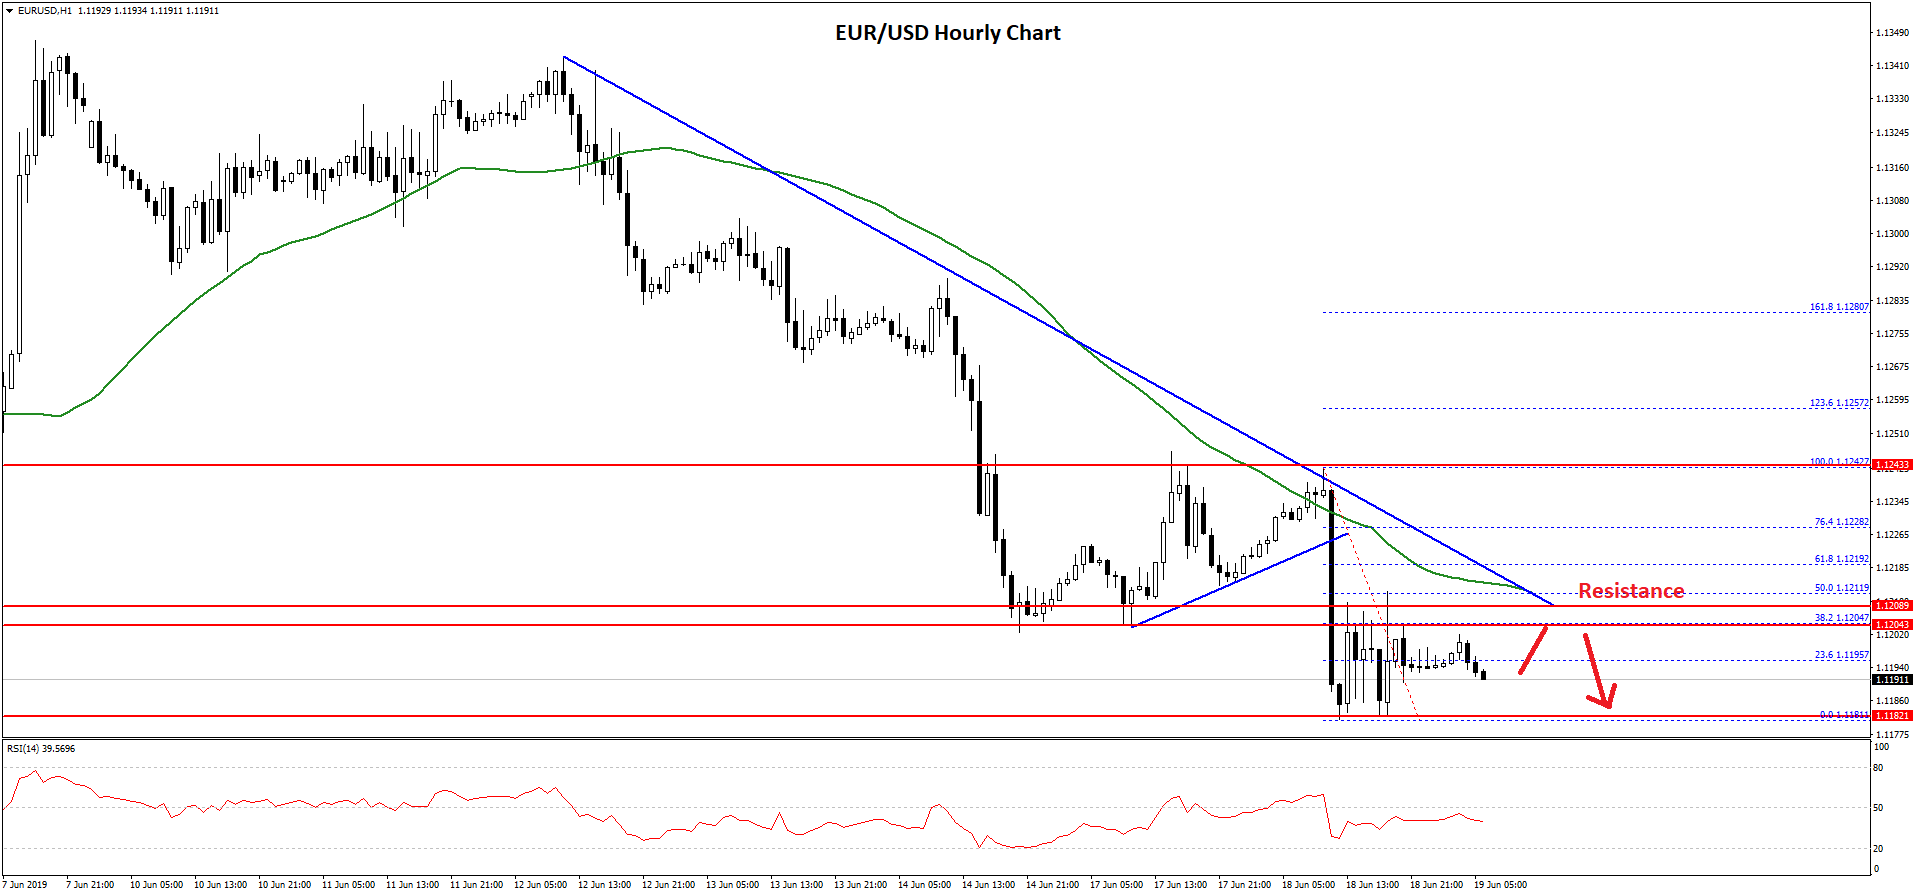
At the moment, the pair is consolidating losses, with corrective moves near 1.1190. It broke the 23.6% Fib retracement level of the recent decline from the 1.1242 high to 1.1181 low.
However, there are many resistances on the upside near the 1.1200 and 1.1210 levels. There is also a key bearish trend line in place with resistance near 1.1215 on the hourly chart of EUR/USD.
The 50% Fib retracement level of the recent decline from the 1.1242 high to 1.1181 low is also near the trend line. Moreover, the 50 hourly simple moving average is positioned near the 1.1212 level.
Therefore, a close above the trend line, 1.1220, and the 50 hourly simple moving average is needed for a fresh increase in the near term.
On the downside, an initial support is near the 1.1185 and 1.1180 levels. If there is a downside break below the 1.1180 support, there are chances of more losses below the 1.1160 and 1.1150 levels.
USD/JPY Technical Analysis
The US Dollar remained confined in a broad range above the 108.00 support area against the Japanese Yen. The USD/JPY pair made many attempts to surpass the 108.70 and 108.80 resistance levels, but it struggled to gain momentum.
The last swing high was formed at 108.61 and the pair is currently moving lower. It broke the 23.6% Fib retracement level of the recent wave from the 108.23 low to 108.61 high.
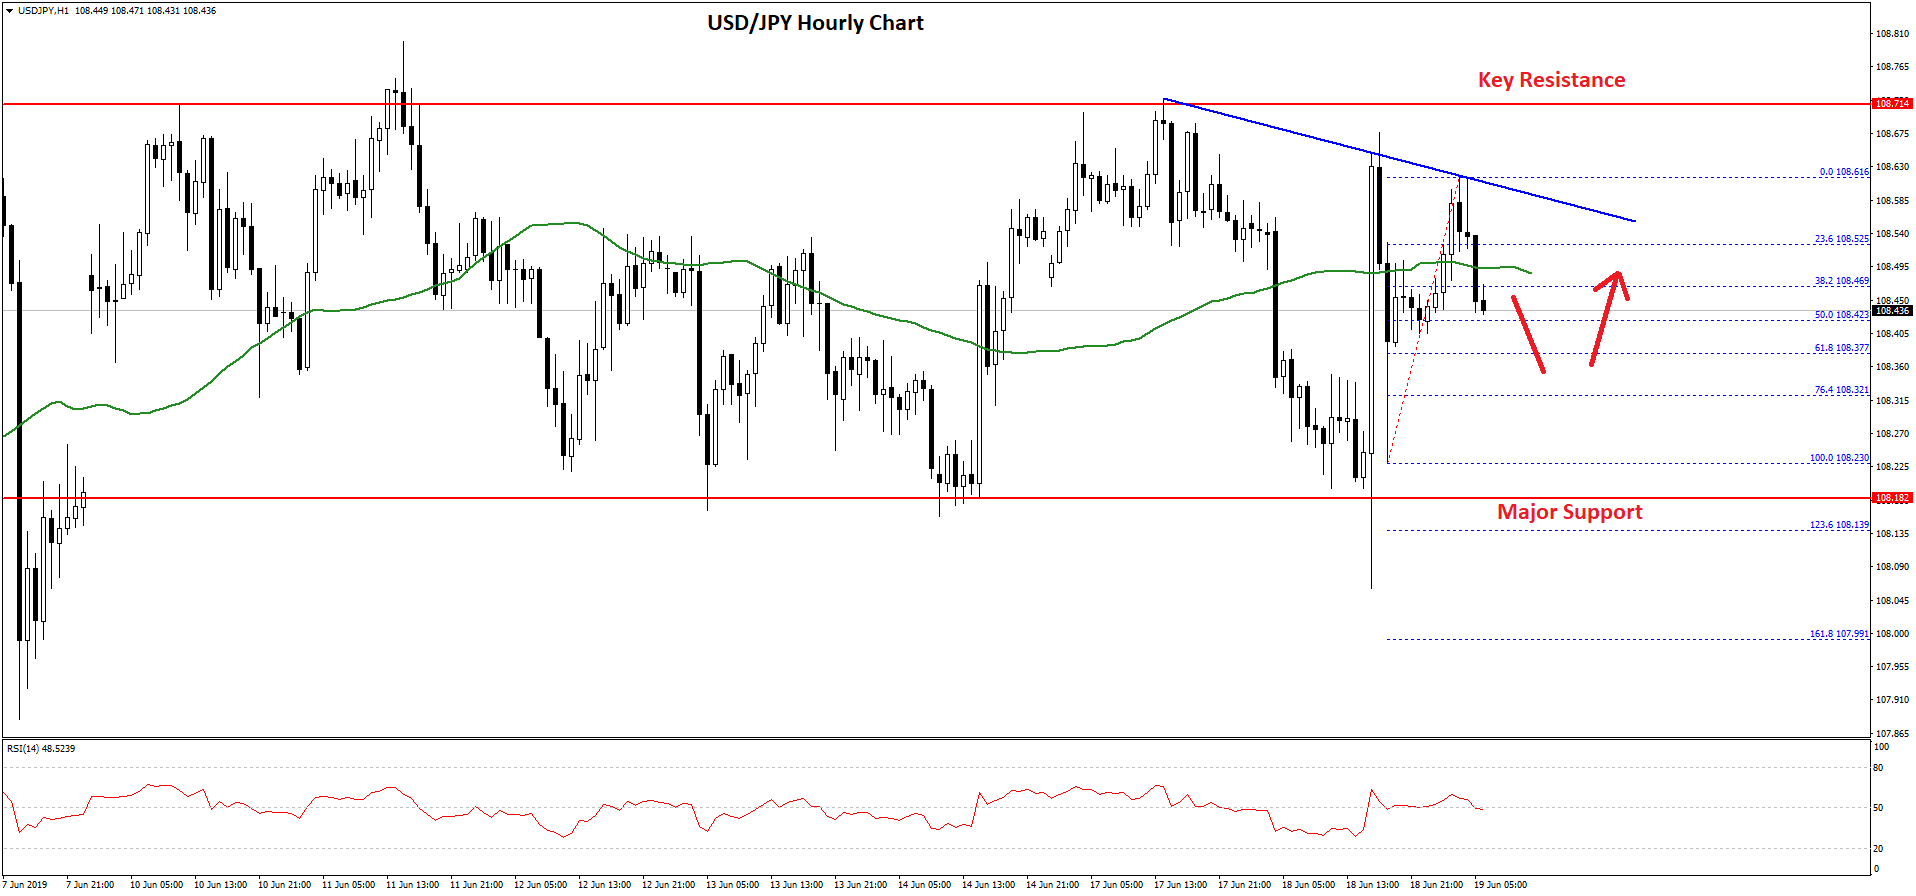
Moreover, there was a break below the 108.50 support and the 50 hourly simple moving average. The pair is now approaching the 108.40 support and the 50% Fib retracement level of the recent wave from the 108.23 low to 108.61 high.
If there are more losses, the pair could revisit the 108.20 or 108.15 support levels. The main support on the downside is near the 108.00 area.
On the upside, there is a short term bearish trend line forming with resistance near 108.60 on the hourly chart. An immediate resistance is near 108.50 and the 50 hourly SMA.
The main resistance for the bulls is near the 108.70 and 108.80 levels, above which USD/JPY is likely to accelerate sharply towards the 109.00 and 109.20 levels in the near term.
Trade over 50 forex markets 24 hours a day with FXOpen. Take advantage of low commissions, deep liquidity, and spreads from 0.0 pips. Open your FXOpen account now or learn more about trading forex with FXOpen.
This article represents the opinion of the Companies operating under the FXOpen brand only. It is not to be construed as an offer, solicitation, or recommendation with respect to products and services provided by the Companies operating under the FXOpen brand, nor is it to be considered financial advice.
Latest from Forex Analysis
Latest articles

AUD/USD Rises Sharply on Inflation News
The Consumer Price Index for Australia was released this morning. According to ForexFactory:
→ CPI in quarterly terms: actual = 1.0%, expected = 0.8%, previous value = 0.6%;
→ CPI in annual terms: actual = 3.5%, expected = 3.4%, previous value = 3.

TSLA Share Price Up About 13% Despite Disappointing Report
Yesterday, TSLA trading closed at USD 144.68 per share, after which Tesla reported its results for the 1st quarter:
→ earnings per share: actual = USD 0.45, forecast = USD 0.49;
→ gross income: actual = USD 21.45 billion, forecast = USD

Market Analysis: Gold Price Corrects Gains While Oil Price Regains Strength
Gold price rallied above $2,400 before correcting lower. Crude oil price is rising and it could climb further higher toward the $85.50 resistance.
Important Takeaways for Gold and Oil Prices Analysis Today
· Gold price rallied significantly above $2,