


FXOpen
EUR/USD declined recently and tested the 1.1510 support area. USD/JPY remains in a solid uptrend and it could continue to move higher towards 114.50.
Important Takeaways for EUR/USD and USD/JPY
- The Euro declined heavily and broke the 1.1580 and 1.1560 support levels.
- There is a major bearish trend line in place with resistance at 1.1650 on the hourly chart of EUR/USD.
- USD/JPY is trading inside a bullish flag with support at 113.40 on the hourly chart.
- The pair may perhaps continue to move higher towards the 114.00 and 114.50 levels.
EUR/USD Technical Analysis
The Euro started a nasty downside move from the 1.1780-1.1800 resistance area against the US Dollar. The EUR/USD pair declined and broke the 1.1650, 1.1580 and 1.1560 support levels.
The pair traded towards the 1.1500 handle and settled below the 50 hourly simple moving average. A low was formed at 1.1508 and later the pair started an upside correction. It corrected above the 1.1550 level and the 50 hourly SMA.
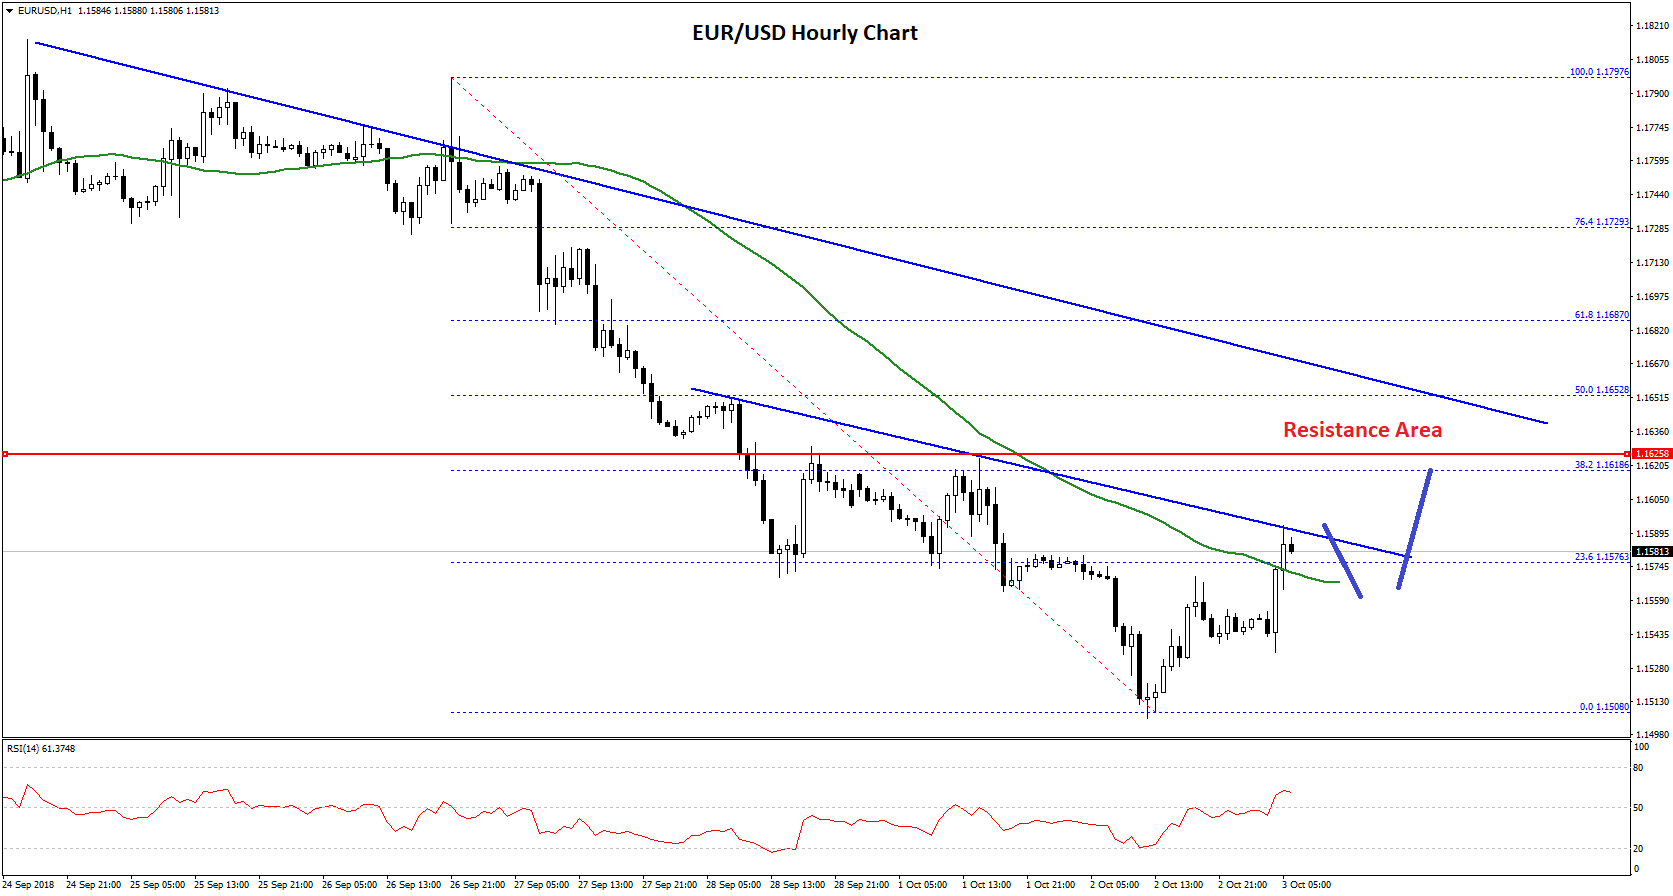
Moreover, there was a break above the 23.6% Fib retracement level of the last decline from the 1.1797 high to 1.1508 low. At present, the pair is testing a connecting bearish trend line with resistance at 1.1590 on the hourly chart.
If the pair breaks the 1.1590-1.1600 zone, there could be more upsides towards the 1.1650 level, which is a strong resistance. It coincides with the 50% Fib retracement level of the last decline from the 1.1797 high to 1.1508 low.
More importantly, there is a major bearish trend line in place with resistance at 1.1650 on the hourly chart of EUR/USD. Therefore, if the pair continues to correct higher, it is likely to face sellers near the 1.1630 and 1.1650 resistance levels.
On the downside, the 1.1550 level is an initial support, below which the price may well revisit the 1.1508 low in the near term.
USD/JPY Technical Analysis
The US Dollar started a solid upward move from the 112.60 swing low against the Japanese Yen. The USD/JPY pair traded higher and cleared the 113.00 and 113.50 resistance levels.
The upside move was strong as the price even cleared the 113.80 resistance and traded as high as 114.06. Later, there was a downside correction and the pair declined below the 113.80 level.
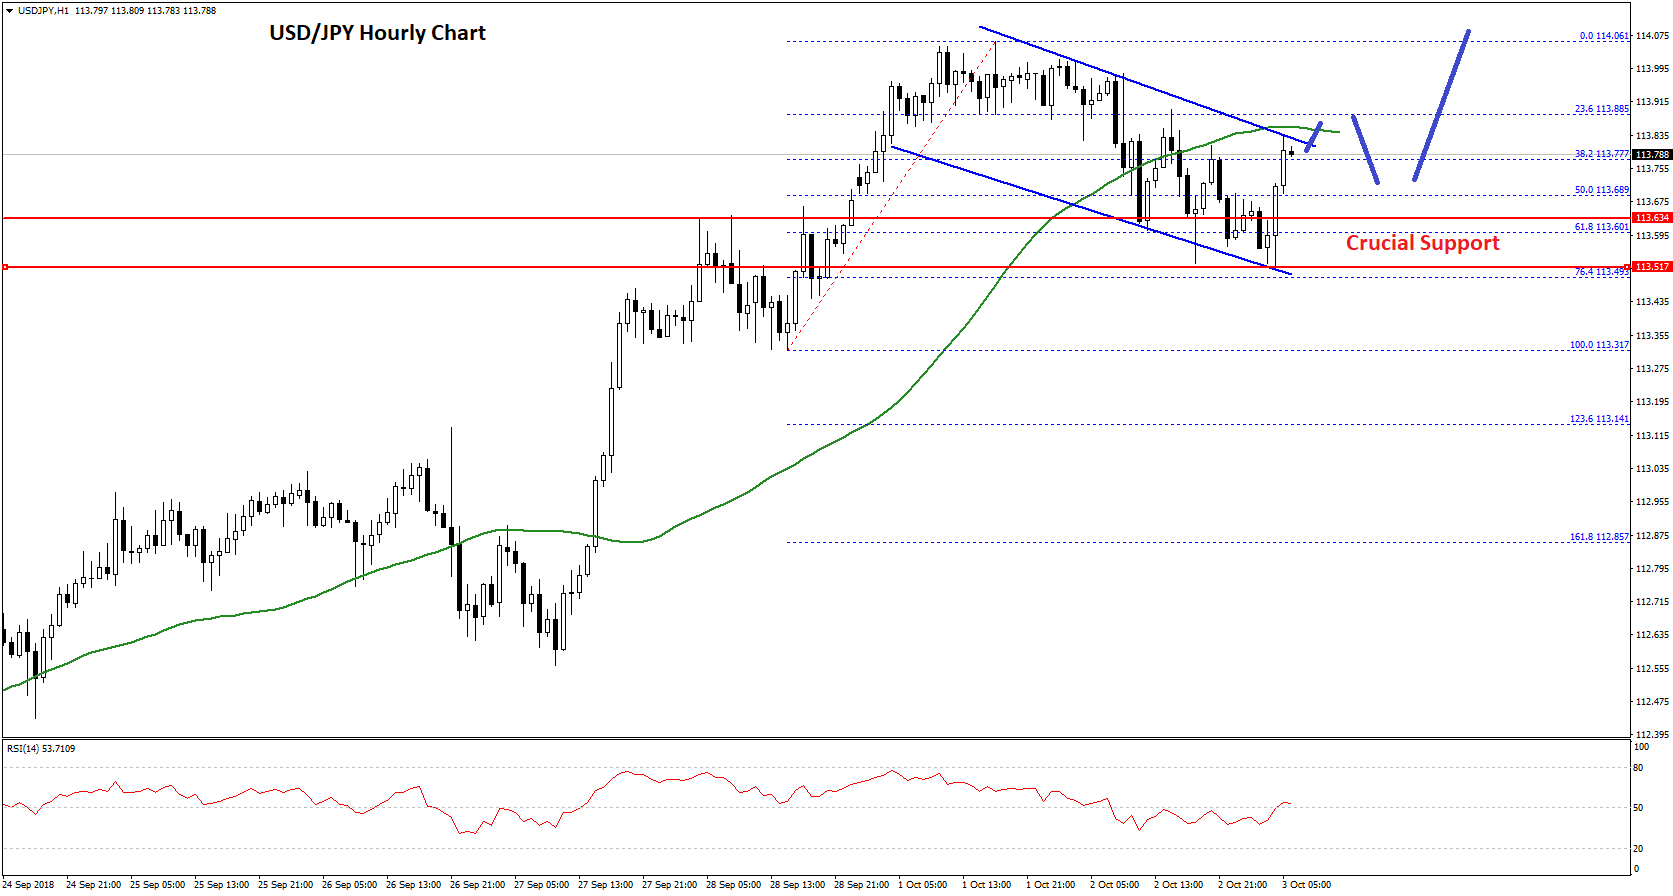
There was also a break below the 113.60 level and the 50 hourly simple moving average. The pair tested the 113.50 support level (the previous resistance) and is currently consolidating in a range. At the outset, there is a bullish flag formed with support at 113.40 on the hourly chart.
The pair is currently testing the channel resistance, the 50% Fib retracement level of the last decline from the 114.06 high to 113.50 swing low, and the 50 hourly SMA. There could be a minor downside correction before buyers attempt to surpass the 113.80-90 resistance.
Once there is a break above the 113.90 resistance, the pair will most likely break the 114.06 high. In the mentioned scenario, the pair could trade further higher towards the 114.50 level.
On the downside, the 113.50 level is a strong support, below which there could be an extended downside correction towards the 113.00 level in the near term.
Trade over 50 forex markets 24 hours a day with FXOpen. Take advantage of low commissions, deep liquidity, and spreads from 0.0 pips. Open your FXOpen account now or learn more about trading forex with FXOpen.
This article represents the opinion of the Companies operating under the FXOpen brand only. It is not to be construed as an offer, solicitation, or recommendation with respect to products and services provided by the Companies operating under the FXOpen brand, nor is it to be considered financial advice.
Latest from Forex Analysis
Latest articles

AUD/USD Rises Sharply on Inflation News
The Consumer Price Index for Australia was released this morning. According to ForexFactory:
→ CPI in quarterly terms: actual = 1.0%, expected = 0.8%, previous value = 0.6%;
→ CPI in annual terms: actual = 3.5%, expected = 3.4%, previous value = 3.

TSLA Share Price Up About 13% Despite Disappointing Report
Yesterday, TSLA trading closed at USD 144.68 per share, after which Tesla reported its results for the 1st quarter:
→ earnings per share: actual = USD 0.45, forecast = USD 0.49;
→ gross income: actual = USD 21.45 billion, forecast = USD

Market Analysis: Gold Price Corrects Gains While Oil Price Regains Strength
Gold price rallied above $2,400 before correcting lower. Crude oil price is rising and it could climb further higher toward the $85.50 resistance.
Important Takeaways for Gold and Oil Prices Analysis Today
· Gold price rallied significantly above $2,