


FXOpen
The Euro and British Pound are trading in a bearish zone against the Japanese Yen. Both EUR/JPY and GBP/JPY have formed similar patterns on the daily chart are both are approaching important resistances.
Important Takeaways for EUR/JPY and GBP/JPY
- The Euro has recovered well from the 124.54 low against the Japanese Yen.
- There is a major bearish trend line with resistance at 130.50 on the daily chart of EUR/JPY.
- GBP/JPY also bounced back after forming support at 143.20.
- A major barrier awaits on the upside near 149.40 and the 50-day SMA.
EUR/JPY Technical Analysis
The Euro declined sharply from the 133.48 swing high in May 2018 against the Japanese Yen. The EUR/JPY pair tumbled and broke the 130.00 and 129.00 support levels.
The decline was such that the pair moved well below the 130.00 handle and the 50-day simple moving average. It even moved a few pips below 125.00 before finding buyers near the 124.50 level during late May 2018.
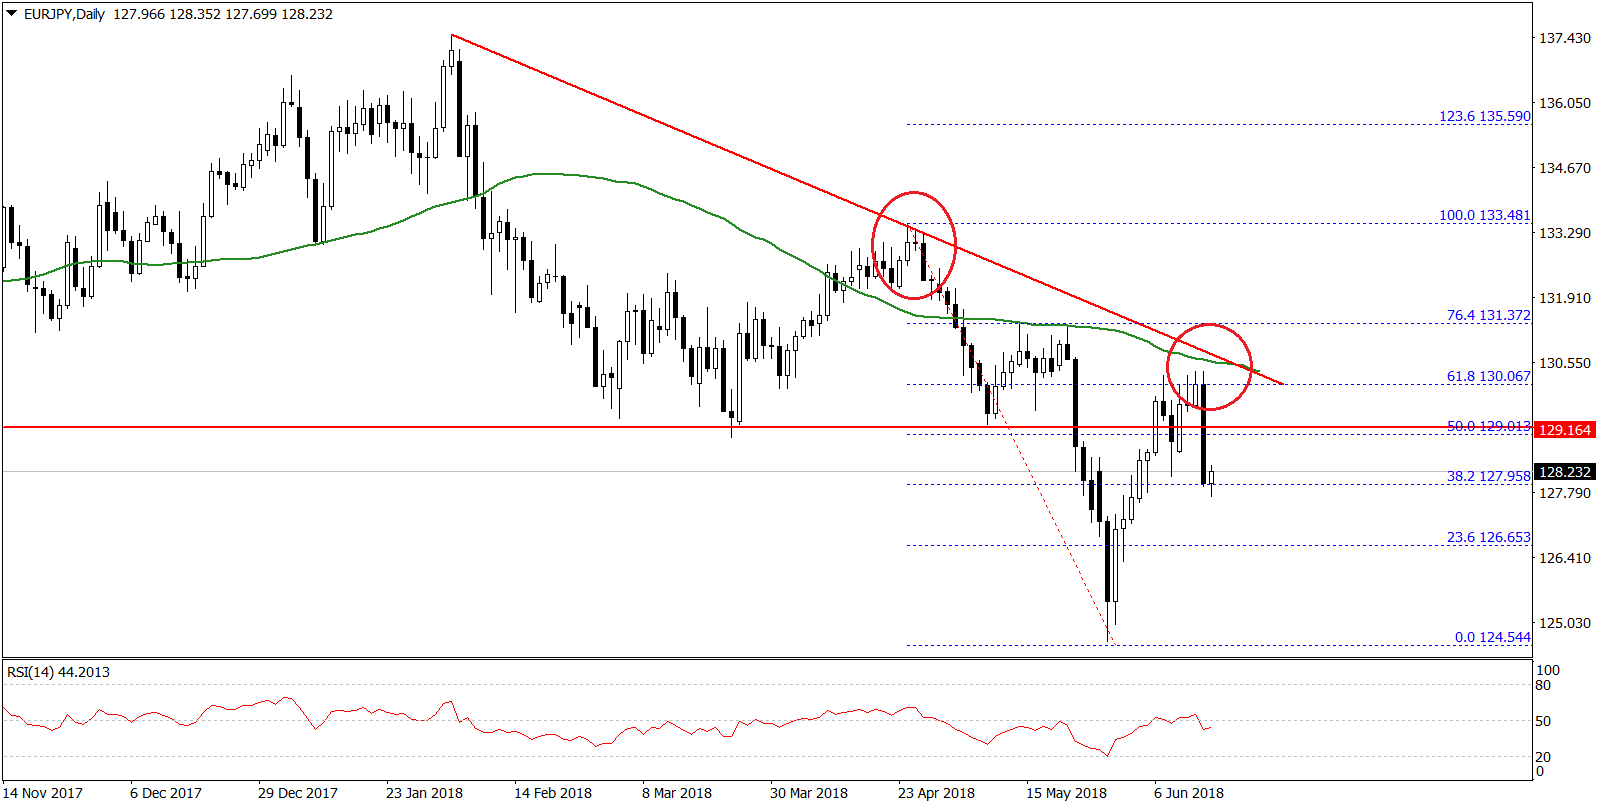
The pair recovered nicely and moved above the 125.00 and 126.00 levels. There was even a break above the 38.2% Fib retracement level of the last decline from the 133.48 high to 124.54 low.
However, the pair is still in a bearish zone (considering medium term trend) since it is well below the 130.00 handle and the 50-day SMA. Moreover, there is a major bearish trend line with resistance at 130.50 on the daily chart of EUR/JPY.
Therefore, a proper close above 130.00 and 50-day SMA is needed for a change in trend. On the downside, supports are seen at 126.50 and 125.00.
Overall, the pair may continue to move higher this month, but it won’t be easy for buyers to surpass the 130.00/50 resistance zone.
GBP/JPY Technical Analysis
The British Pound also followed a similar pattern and declined heavily from the 153.80 level in May 2018 against the Japanese Yen. The GBP/JPY pair broke the 150.00 and 148.50 support levels to move into a bearish zone.
It even cracked the 145.00 support and settled below the 50-day SMA. It traded as low as 143.19 before forming a support base for an upside move. It corrected higher and traded above the 23.6% Fib retracement level of the last decline from the 153.85 high to 143.19 low.
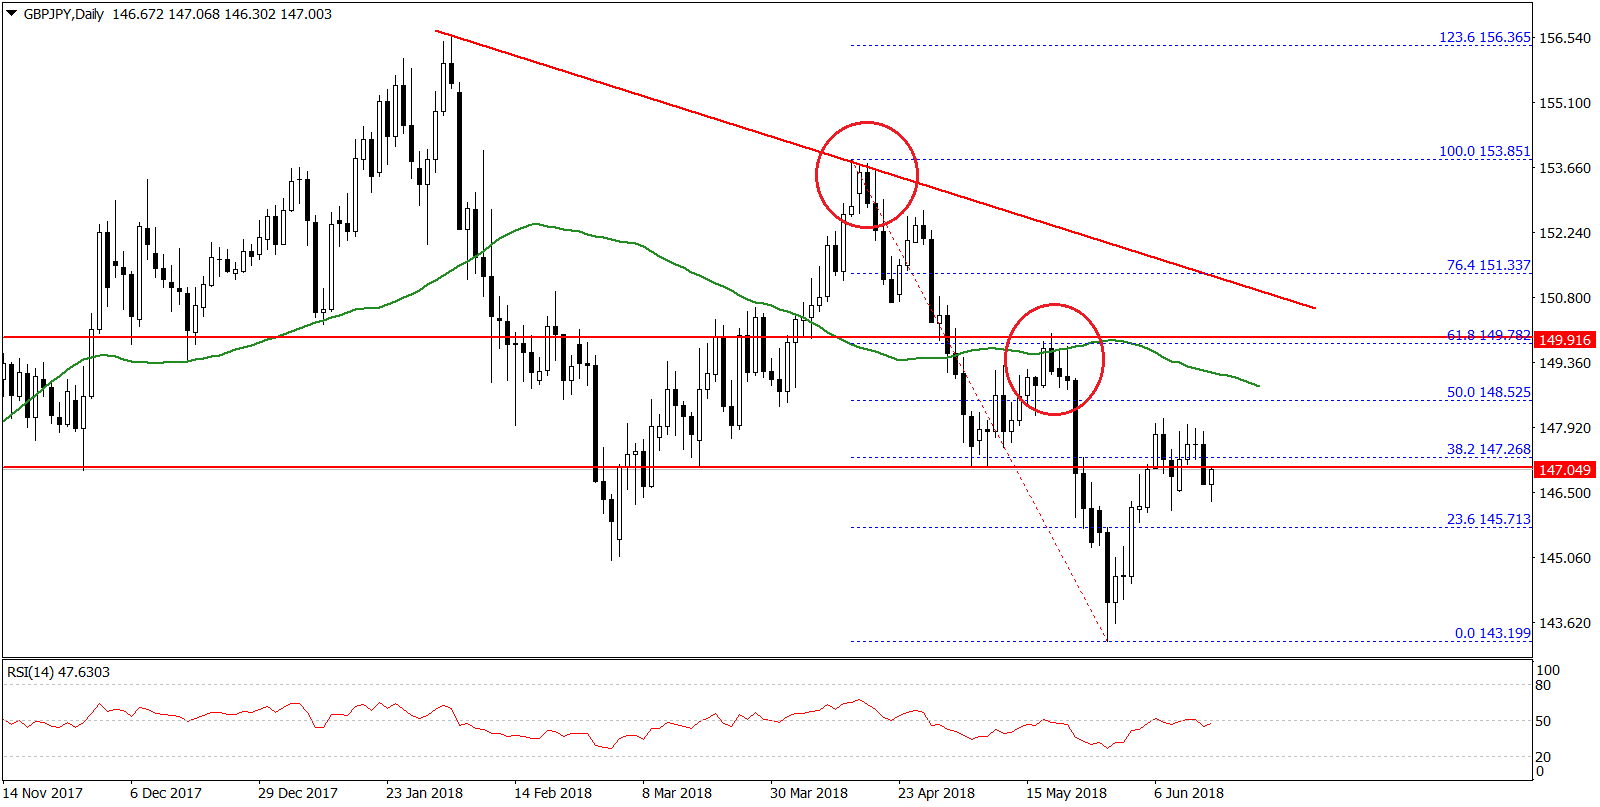
However, there are many barriers on the upside, including 147.20, 148.50 and a key bearish trend line with resistance at 150.80 on the daily chart. The most important one is 148.50 since it coincides with the 50% Fib retracement level of the last decline from the 153.85 high to 143.19 low.
Considering the current trend, the pair may perhaps correct further higher, but it will most likely struggle to break the 148.50 resistance zone. On the downside, supports are seen near 145.00 and 143.50.
Trade over 50 forex markets 24 hours a day with FXOpen. Take advantage of low commissions, deep liquidity, and spreads from 0.0 pips. Open your FXOpen account now or learn more about trading forex with FXOpen.
This article represents the opinion of the Companies operating under the FXOpen brand only. It is not to be construed as an offer, solicitation, or recommendation with respect to products and services provided by the Companies operating under the FXOpen brand, nor is it to be considered financial advice.
Latest from Forex Analysis
Latest articles

Anchored VWAP and How You Can Use It in Forex Trading
In the world of forex trading, understanding the nuanced tools at your disposal can significantly enhance decision-making processes. One such sophisticated tool is the Anchored Volume-Weighted Average Price (Anchored VWAP), which refines the standard VWAP by allowing traders to set

META Share Price Collapses after Publication of Quarterly Report
Just yesterday, META's stock price closed at USD 493.50, up approximately 40% since the start of 2024 and up nearly 300% since the start of 2023.
However, following the release of Meta's quarterly report, its shares plummeted to USD

USD/JPY Analysis: The Rate Exceeds The Level of 155 Yen Per US Dollar
Today, the price of USD/JPY once again renewed its 34-year high, exceeding the level of 155 yen per dollar, which put pressure on the current authorities.
According to Reuters, officials are trying to maintain calm in the market.
"We