


FXOpen

EUR/USD slowly and steadily moved higher from the 1.1580 support. On the other hand, USD/JPY broke a key support at 110.90 to move into a bearish zone.
Important Takeaways for EUR/USD and USD/JPY
- The Euro is slowly moving higher towards the 1.1690-1.1700 resistance area.
- There is a crucial bullish trend line and support formed at 1.1640 on the hourly chart of EUR/USD.
- USD/JPY broke a major ascending channel support at 110.90 on the hourly chart.
- Japan’s Services Purchasing Managers Index (PMI) in June 2018 increased from 51.0 to 51.4.
EUR/USD Technical Analysis
The Euro formed a decent support base above 1.1520 against the US Dollar. The EUR/USD pair started a fresh upward move and broke a few important hurdles near the 1.1550 and 1.1580 levels.
As a result, there were further gains and the pair moved above the 1.1650 level. An intermediate low was formed at 1.1591 and the pair is currently trading well above the 50% Fib retracement level of the last decline from the 1.1690 high to 1.1591 low.
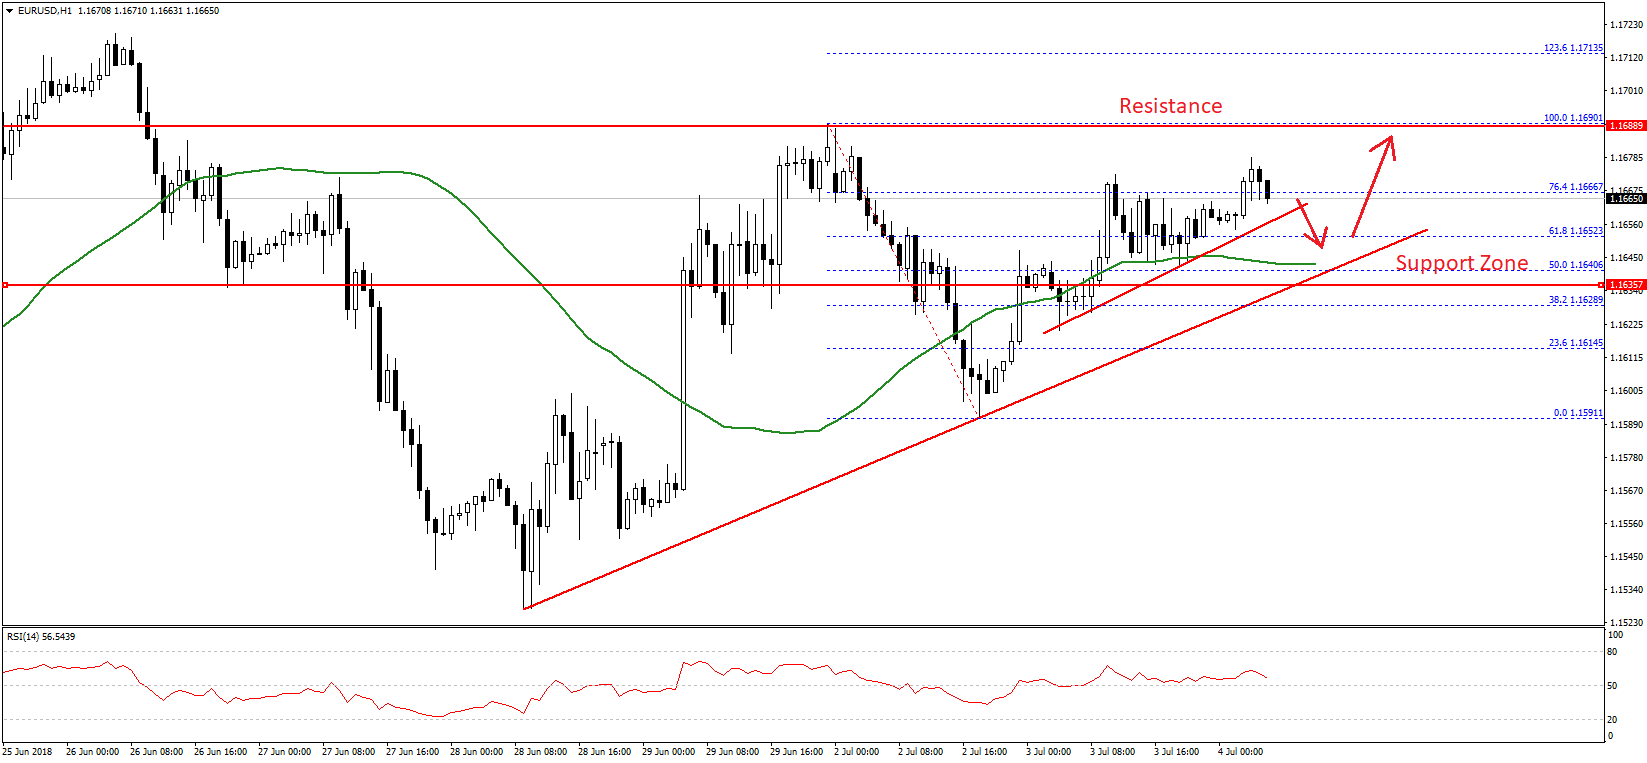
The 1.1675 level is acting as a resistance, but there are many supports on the downside above the 1.1640 level. There is also a crucial bullish trend line and support formed at 1.1640 on the hourly chart.
The trend line support is positioned near the 50 hourly simple moving average and the 1.1650 pivot level. Should the pair fails to stay above the 1.1640-50 support zone, it could move back towards the 1.1600 support.
On the flip side, if the continues to move higher, it may perhaps test the last swing high at 1.1690, above which, there are chances of an upside break above the 1.1700 resistance.
Today, the Euro Zone Services PMI report for June 2018 is scheduled for the release. The market forecast is 55, similar to the last 55.
USD/JPY Technical Analysis
The US Dollar was in a major uptrend from the 109.40 swing low the Japanese Yen. The USD/JPY pair traded above the 110.50 and 111.00 levels, but it could not hold gains above 111.00.
As a result, there was a downside reaction and the pair declined below the 110.80 support. More importantly, the pair broke a major ascending channel support at 110.90 on the hourly chart.
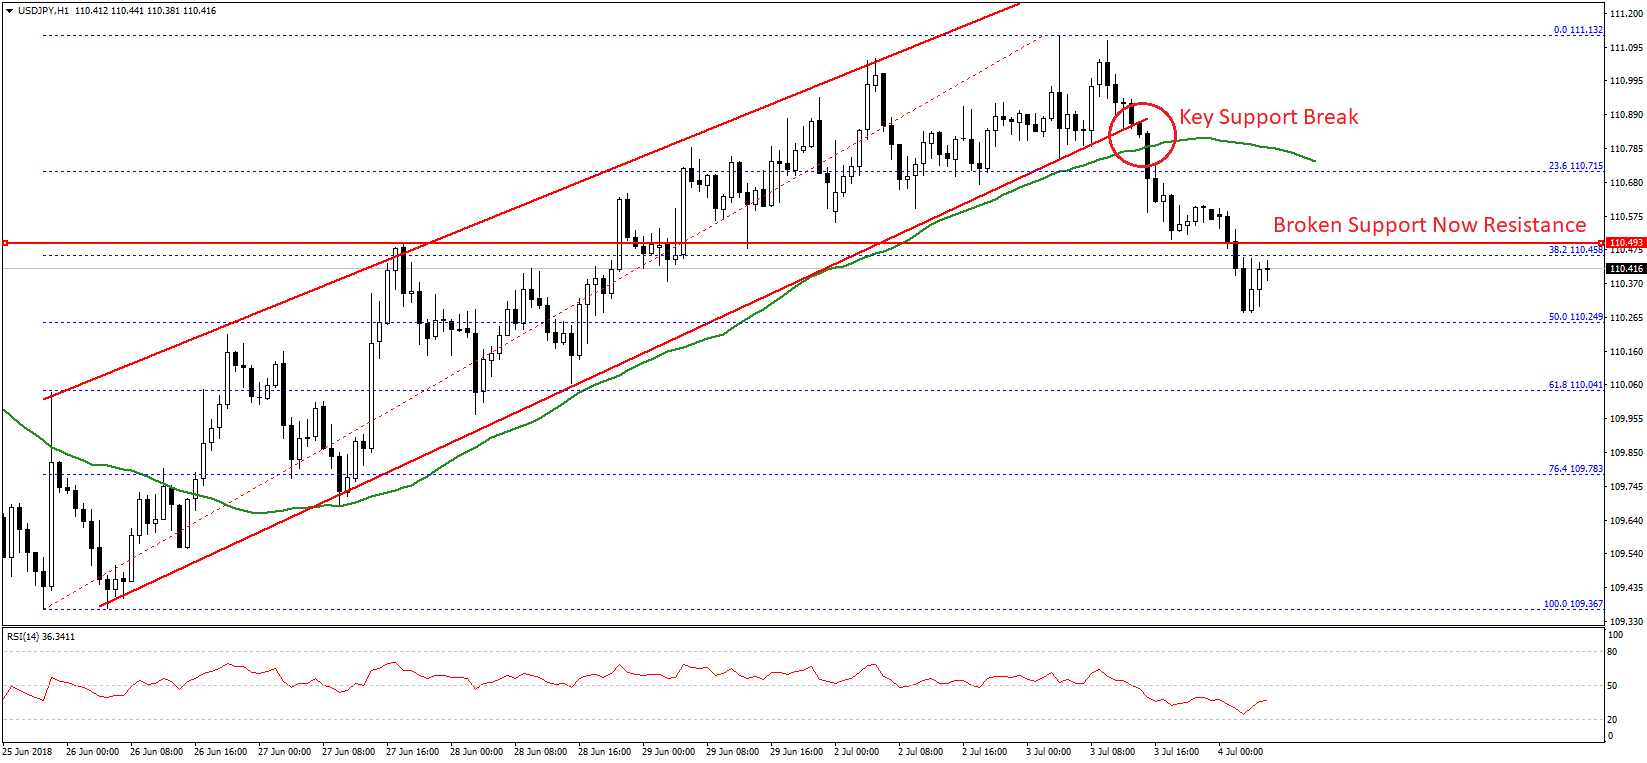
The decline got traction and the pair broke the 23.6% Fib retracement level of the last wave from the 109.36 low to 111.13 high. It also settled below the 110.50 support and the 50 hourly simple moving average.
The pair almost tested the 50% Fib retracement level of the last wave from the 109.36 low to 111.13 high. At the moment, the pair is correcting higher, but the previous support at 110.50 may perhaps act as a resistance along with the 50 hourly SMA.
A break above the 110.50 resistance and the 50 hourly SMA may perhaps put the pair back in a bullish zone. On the flip side, a failure could ignite more losses below the 110.30 level in the near term.
Today in Japan, the Services Purchasing Managers Index (PMI) for June 2018 was released by Markit Economics. The market was looking for a rise from the last reading of 51.0 to 51.6.
The actual result was a bit lower as the increase was 0.4 to 51.4. However, the overall outcome was positive as the report mentioned that there was a strong expansion in new orders, pushing backlogs higher.
Trade over 50 forex markets 24 hours a day with FXOpen. Take advantage of low commissions, deep liquidity, and spreads from 0.0 pips. Open your FXOpen account now or learn more about trading forex with FXOpen.
This article represents the opinion of the Companies operating under the FXOpen brand only. It is not to be construed as an offer, solicitation, or recommendation with respect to products and services provided by the Companies operating under the FXOpen brand, nor is it to be considered financial advice.
Latest from Forex Analysis
Latest articles

S&P 500 Rebounds after Negative GDP News
Data released yesterday showed US GDP growth slowed to 1.6% in the first quarter of the year. According to ForexFactory: forecast = 2.2%, past value = 2.4%.
Reaction to the news sent the S&P 500 mini stock

GBP/USD And USD/CAD Daily Chart Outlook
GBP/USD is attempting a recovery wave from 1.2300. USD/CAD is consolidating and might aim for a move above the 1.3760 resistance zone.
Important Takeaways for GBP/USD and USD/CAD Analysis Today
· The British Pound started

Anchored VWAP and How You Can Use It in Forex Trading
In the world of forex trading, understanding the nuanced tools at your disposal can significantly enhance decision-making processes. One such sophisticated tool is the Anchored Volume-Weighted Average Price (Anchored VWAP), which refines the standard VWAP by allowing traders to set