


FXOpen

One of the most interesting technical analysis indicators comes from Japan. The Ichimoku Kinko Hyo, by its complete name, means, in rough translation, “equilibrium at a glance.”
It is, indeed, an indicator that shows the equilibrium state in the market. Perhaps the only indicator to show both future and past support and resistance levels, the Ichimoku is famous among both trend traders and traders that use oscillators to back their trades.
The Ichimoku Elements
The Ichimoku indicator is quite complex and traders that make the most of it use it about past, present, and future prices.
Its most famous element, the cloud or Kumo, it is renowned for its trending component, but also for providing future support and resistance levels. Formed out of two elements (Senkou A and Senkou B), the cloud becomes bullish or bearish depending on the cross of the two lines that make Senkou A and B.
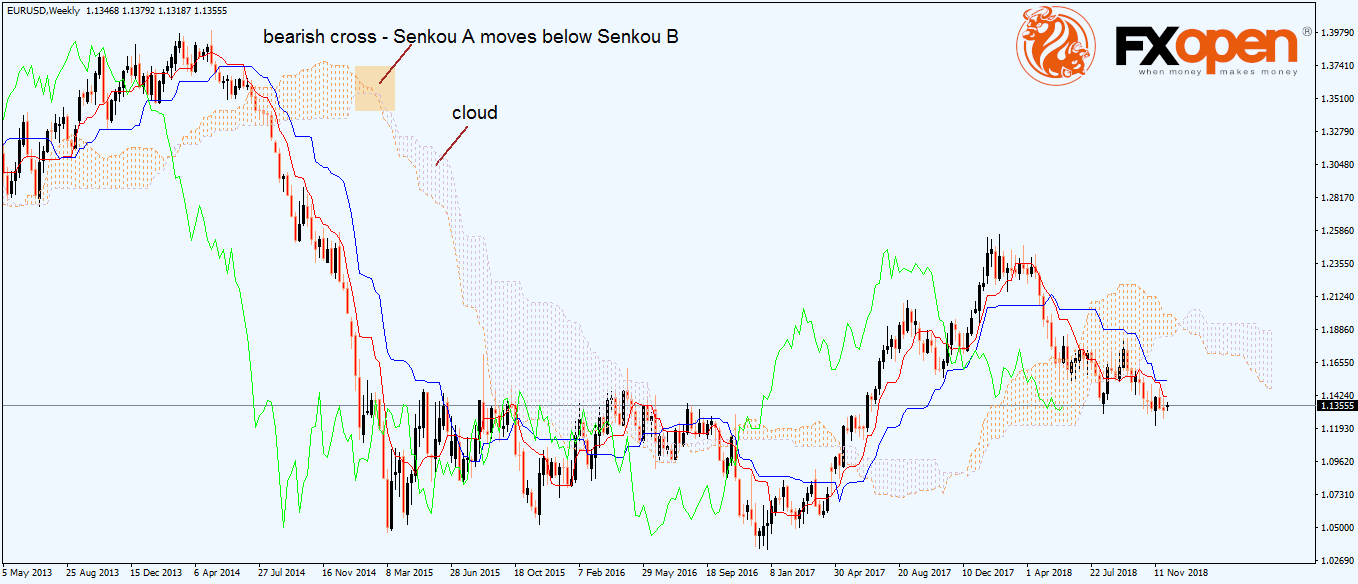
In strong trends, the price always remains below the cloud (in a bearish environment) or above it (in a bullish trend).
To fully understand the Ichimoku indicator, traders need to remember that the cloud is a projection ahead in time. The indicator uses twenty-six periods to project the cloud on the right side of the chart, effectively pointing out future support or resistance levels. In other words, traders know in advance where is most likely for the price to hesitate.
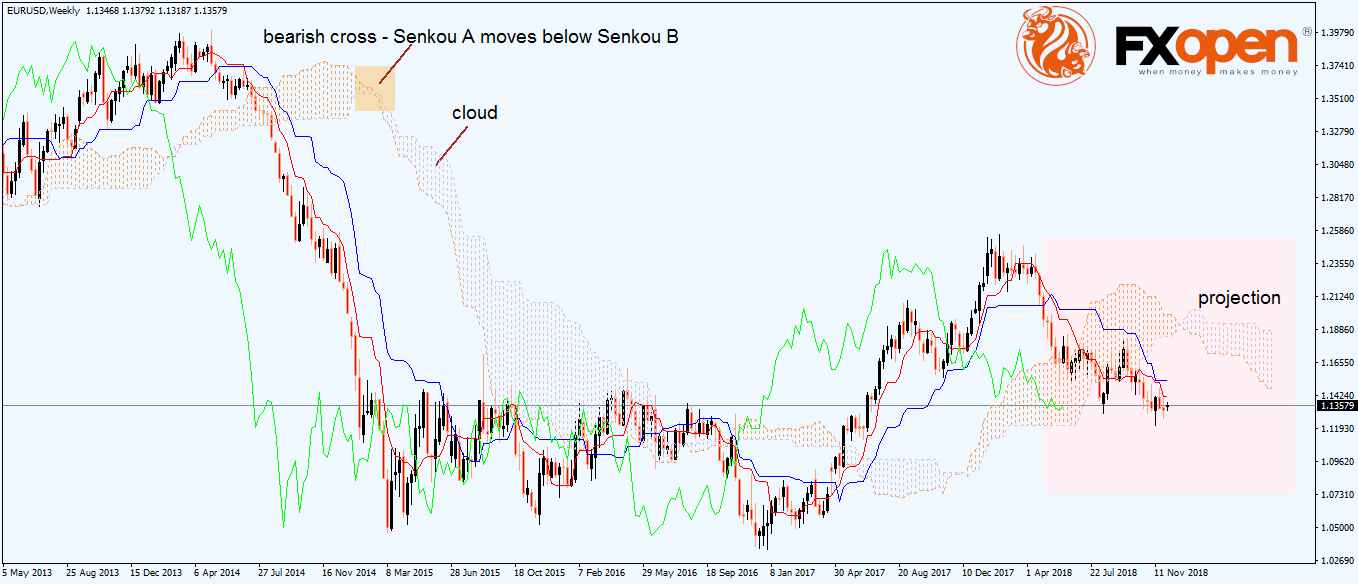
In other words, when doing back-testing with the Ichimoku indicator, one must always consider that for any given candlestick the cloud is projected twenty-six periods on the right side. In this case, the EURUSD weekly timeframe shows the Ichimoku cloud projected twenty-six weeks on the right side, showing potential resistance (as the price currently sits below the cloud).
Besides the cloud, three more lines are part of the Ichimoku system: the Kinjun (blue line), Tenkan (red line) and Chinkou (green line).
Before going into more details, focus on where the current price is and look on the right and left of it. The cloud is projected twenty-six periods on the right side, while Chinkou twenty-six periods on the left.
The actual price sits in the middle, with the cloud providing future support or resistance and the Chinkou reacting to both previous candles and the cloud in the past.
Forex Equilibrium Strategy: How to Trade with the Ichimoku Indicator
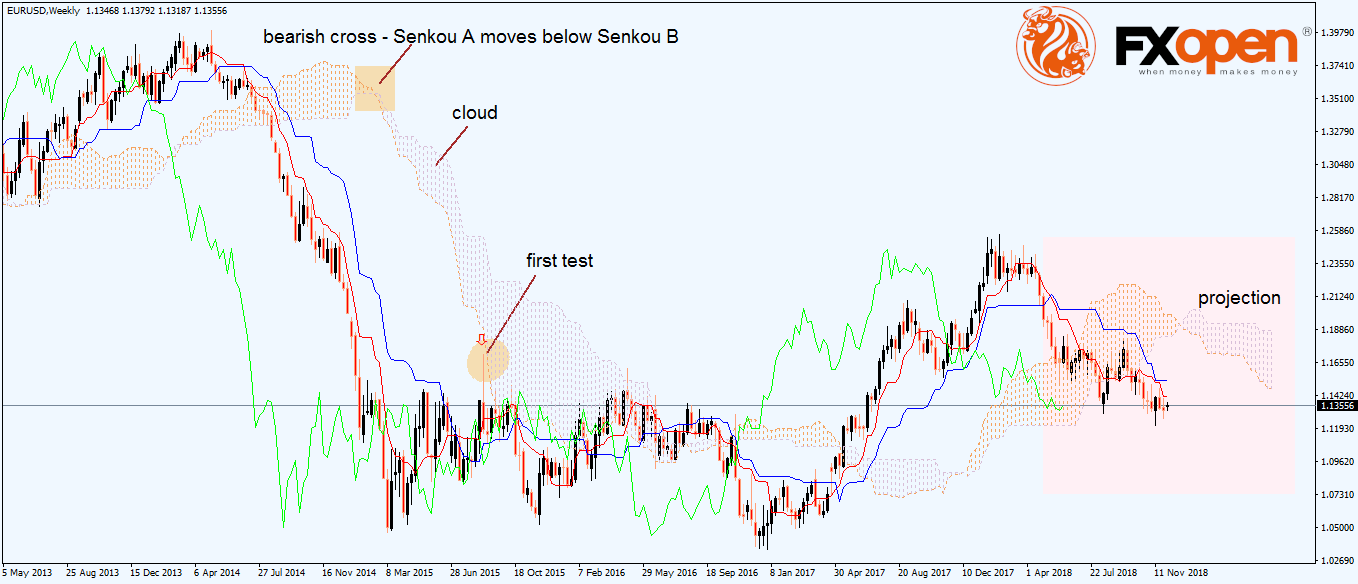
In strong trends, the price stays far away from the cloud. If it has the power to reach the cloud after a longer trending period, most likely the cloud will reject it at least at the first test. The more the price has the power to test the cloud, the weaker the support or resistance becomes.
Using the same EURUSD example, by the time the price attempted to reach the cloud, it got rejected strongly due to the previous steep, bearish trend. Eventually, the resistance gives way as the price found it relatively easy to come back to the cloud.
Another way to trade with the Ichimoku is to use the Kinjun and Tenkan cross as a signal to go long or short. They act like two moving averages, with the Tenkan being fastest and Kinjun slower.
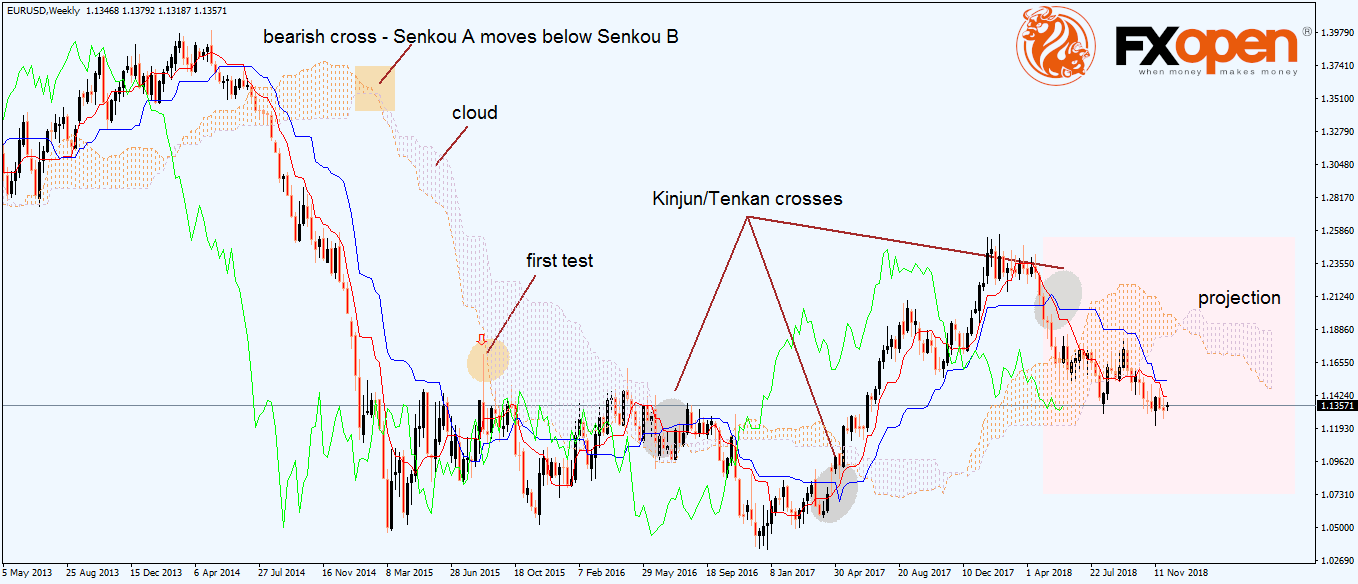
For as long as the Tenkan remains above the Kinjun, the bullish trend will continue. The same is true on a bearish trend: for as long as the Tenkan remains below the Kinjun, the bearish conditions will continue.
Conclusion
There’s more to the Ichimoku cloud than meets the eye. The idea of this article was to show the elementary ways of interpreting the market using the Ichimoku, and so to get familiar with this unique way to trade.
However, we left the Chinkou intentionally for some other article, as it needs special attention.
To sum up, think of the Ichimoku as, perhaps, the only indicator to project future support and resistance levels, while, at the same time, having both a trending and an oscillating condition. For many traders, it is enough to interpret markets correctly.
This article represents the opinion of the Companies operating under the FXOpen brand only. It is not to be construed as an offer, solicitation, or recommendation with respect to products and services provided by the Companies operating under the FXOpen brand, nor is it to be considered financial advice.
Latest articles

UK100 Share Index Rises as UK Inflation Slows
Yesterday, the UK Office for National Statistics (ONS) reported that the CPI stood at 3.2% in March. According to ForexFactory, analysts expected 3.1%, and a month ago the index was 3.4%.
Grant Fitzner, chief economist at the

The Dollar is Corrected after the Comments of the Head of the Federal Reserve
Good data on the labour market in the United States and the continuous rise in inflation for several months are helping to reduce experts’ expectations about a change in the vector of monetary policy in the United States. Recent comments

Is There the Best Time to Trade Stock CFDs?
If you ask experienced traders, many will say that they trade on certain days or at certain times of the day. Their choice is determined by the market dynamics, volatility, and liquidity. It’s crucial to understand when the best