


FXOpen
GBP/USD declined sharply from the 1.3300 resistance zone. AUD/USD is currently correcting lower and it could decline towards the 0.7220 support.
Important Takeaways for GBP/USD and AUD/USD
- The British Pound failed to move above the 1.3280 and 1.3300 resistance levels.
- GBP/USD broke a crucial bullish trend line with support at 1.3170 on the hourly chart.
- AUD/USD surpassed a major connecting bullish trend line with support at 0.7290 on the hourly chart.
- The pair may continue to correct lower towards the 0.7220 support level in the near term.
GBP/USD Technical Analysis
The British Pound traded higher this past week from the 1.3125 swing low against the US Dollar. The GBP/USD pair traded above a couple of important hurdles like 1.3200 and 1.3250.
The pair even moved towards the 1.3300 level, but buyers failed to retain control. There was a high formed at 1.3298 and the pair started a downside move. There was a sharp downside move and GBP/USD tumbled below the 1.3220 and 1.3200 levels.
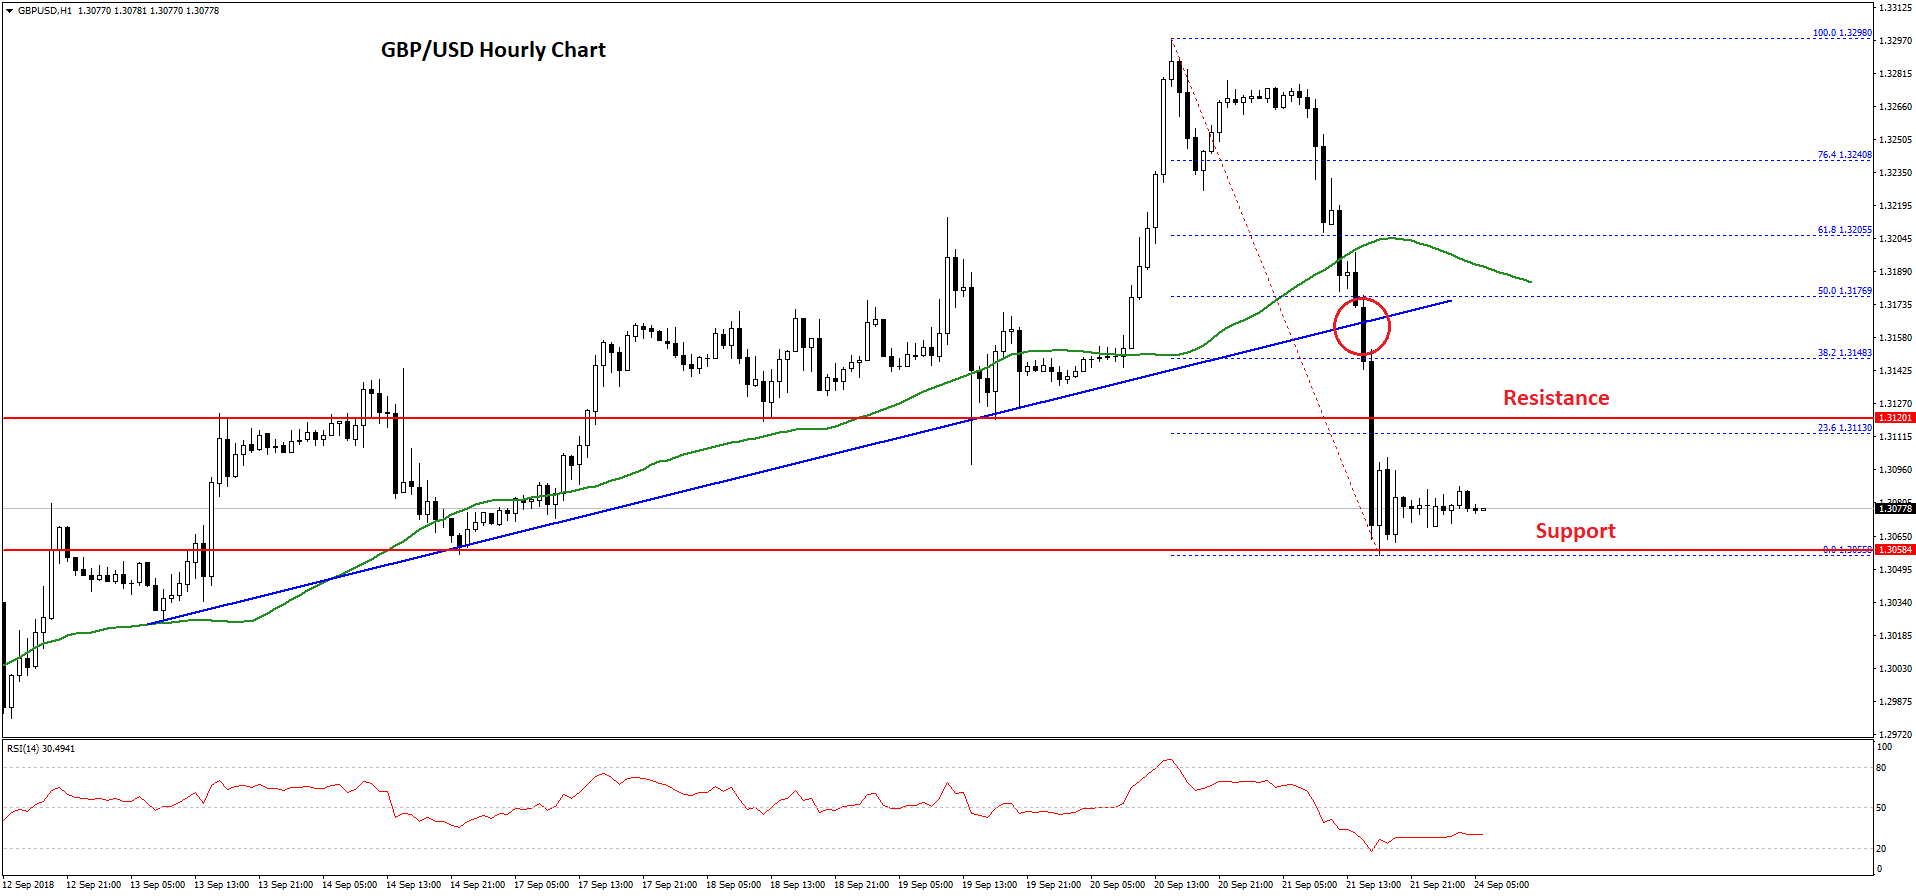
During the decline, the pair broke a crucial bullish trend line with support at 1.3170 on the hourly chart. There was also a close below the 1.3200 level and the 50 hourly simple moving average. The pair even broke 1.3100 and traded as low as 1.3055.
At the moment, the pair is consolidating losses above the 1.3050 level. An initial resistance is near the 23.6% Fib retracement level of the last drop from the 1.3299 high to 1.3055 low.
If there is a correction above the 1.3100 and 1.3120 levels, the pair could revisit the 1.3180 zone and the 100 hourly SMA. More importantly, the 50% Fib retracement level of the last drop from the 1.3299 high to 1.3055 low is near the 1.3175 level.
Therefore, recoveries towards the 1.3120 and 1.3175 levels are likely to face strong hurdles on the upside. On the downside, if the pair fails to hold the 1.3050 support, there could be a break towards the 1.3000 handle. Below the 1.3000 handle, the pair may well decline towards the 1.2960 support.
AUD/USD Technical Analysis
The Aussie Dollar recovered nicely this past week from the 0.7140 support area against the US Dollar. The AUD/USD traded higher and broke a few important resistances near the 0.7200 and 0.7250 levels.
The pair even traded above the 0.7300 level, but buyers failed to hold gains. A high was formed at 0.7303 and later the pair started a downside correction. It moved down and broke the 0.7300 level and a major connecting bullish trend line with support at 0.7290 on the hourly chart.
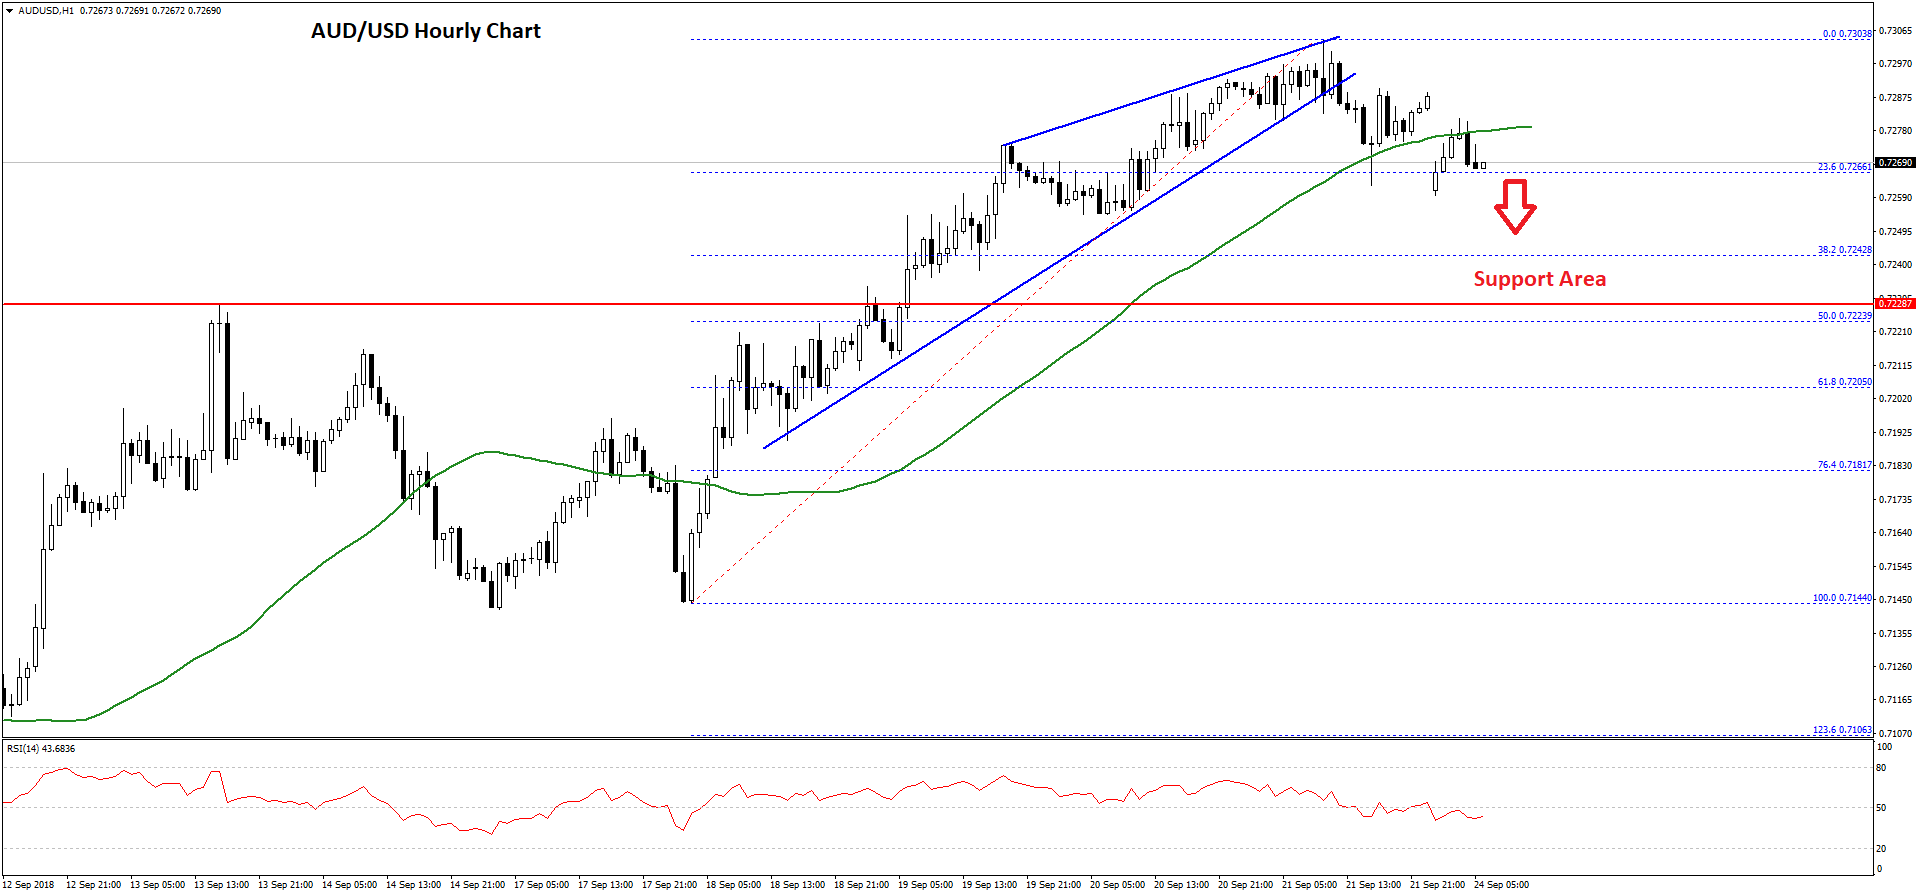
Moreover, there was a close below the 0.7275 level and the 50 hourly SMA. The pair is currently testing the 23.6% Fib retracement level of the last wave from the 0.7144 low to 0.7303 high.
On the downside, the next major support is near the 0.7245 level. Below this, the pair could test the 50% Fib retracement level of the last wave from the 0.7144 low to 0.7303 high at 0.7223.
Overall, it seems like AUD/USD may correct lower in the near term towards the 0.7220 support. On the other hand, if the pair bounces back and clears the 0.7285 resistance plus the 50 hourly SMA, it could trade towards the 0.7303 high or 0.7320.
Trade over 50 forex markets 24 hours a day with FXOpen. Take advantage of low commissions, deep liquidity, and spreads from 0.0 pips. Open your FXOpen account now or learn more about trading forex with FXOpen.
This article represents the opinion of the Companies operating under the FXOpen brand only. It is not to be construed as an offer, solicitation, or recommendation with respect to products and services provided by the Companies operating under the FXOpen brand, nor is it to be considered financial advice.
Latest from Forex Analysis
Latest articles

What Is a Break of Structure and How Can You Trade It?
In the ever-evolving world of Smart Money Concept (SMC) trading, a nuanced understanding of market dynamics is indispensable. This article explores the concept of Break of Structure (BOS), how to identify it, and its implications for trading strategies, setting traders

Hong Kong Stocks Become Top Risers After Wild Ride Subsides
Hong Kong enjoyed a sterling reputation for an entire century as a highly polished, utterly stable mantlepiece upon which global corporations could comfortably sit and where an international talent base could reside in fabulous surroundings and approach European, American, African

Brent Oil Price Did Not Rise Despite Iran's Attack on Israel
As you know, Iran launched a missile attack on Israel over the weekend. This could greatly increase the price of Brent oil, given that Iran is one of the top 10 oil producing countries, and the fact of the strike