


FXOpen
GBP/USD failed to stay above 1.3000 and declined below 1.2950. EUR/GBP is currently correcting higher, but it could face hurdles near 0.8950/0.8960.
Important Takeaways for GBP/USD and EUR/GBP
- The British Pound remains at a risk of more losses towards the 1.2870 level.
- There was a break below a key bullish trend line with support at 1.2930 on the hourly chart of GBP/USD.
- EUR/GBP is facing many resistances near the 0.8950 and 0.8960 levels.
- There is a major bearish trend line in place with resistance at 0.8970 on the hourly chart.
GBP/USD Technical Analysis
The British Pound recovered nicely this past week after forming a low near the 1.2800 level against the US Dollar. The GBP/USD pair jumped above the 1.2950 and 1.3000 level, but later it failed to hold gains and corrected lower.
The pair traded as high as 1.3027 and moved down. It broke the 1.3000 and 1.2980 support levels to enter into a bearish zone. There was also a break below the 50% Fib retracement level of the last wave from the 1.2873 low to 1.3027 high.
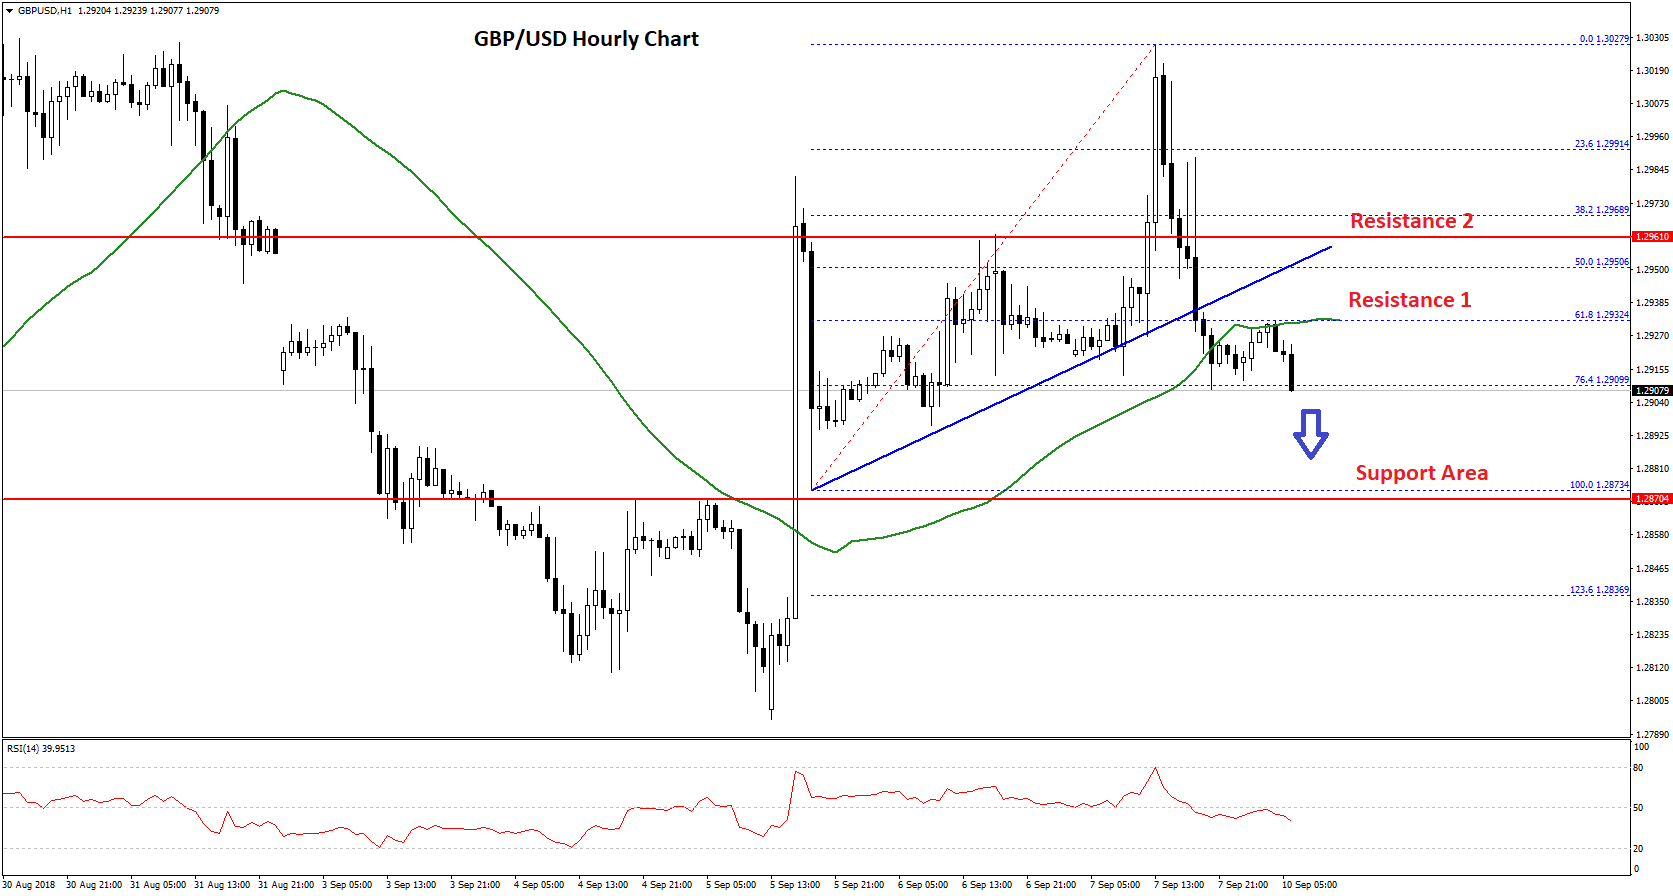
Moreover, there was a break below a key bullish trend line with support at 1.2930 on the hourly chart. Later, the pair settled below the 1.2920 support and the 50 hourly simple moving average. It has opened the doors for more losses and the pair could continue to move down towards the 1.2880 support zone.
If there are more declines below 1.2880, the pair may even test the 1.236 Fib extension level of the last wave from the 1.2873 low to 1.3027 high at 1.2836.
On the upside, the broken support near the 1.2920 level and the 50 hourly SMA are initial hurdles for cable buyers. Above these, GBP/USD is likely to face a strong resistance near the 1.2950 and 1.2960 levels.
Overall, the pair is currently trading in a bearish zone and if there is an upside correction, sellers are likely to appear near the 1.2950 zone.
EUR/GBP Technical Analysis
The Euro gained traction this past week and moved above the 0.9000 resistance against the British Pound. The EUR/GBP pair traded towards the 0.9040 level where sellers emerged, resulting in a downside correction.
The pair declined recently after forming a short-term top near the 0.9045 level. During the decline, the pair broke the 0.9000 and 0.8990 support levels. Moreover, there was a break below a crucial bullish trend line with support at 0.8985 on the hourly chart.
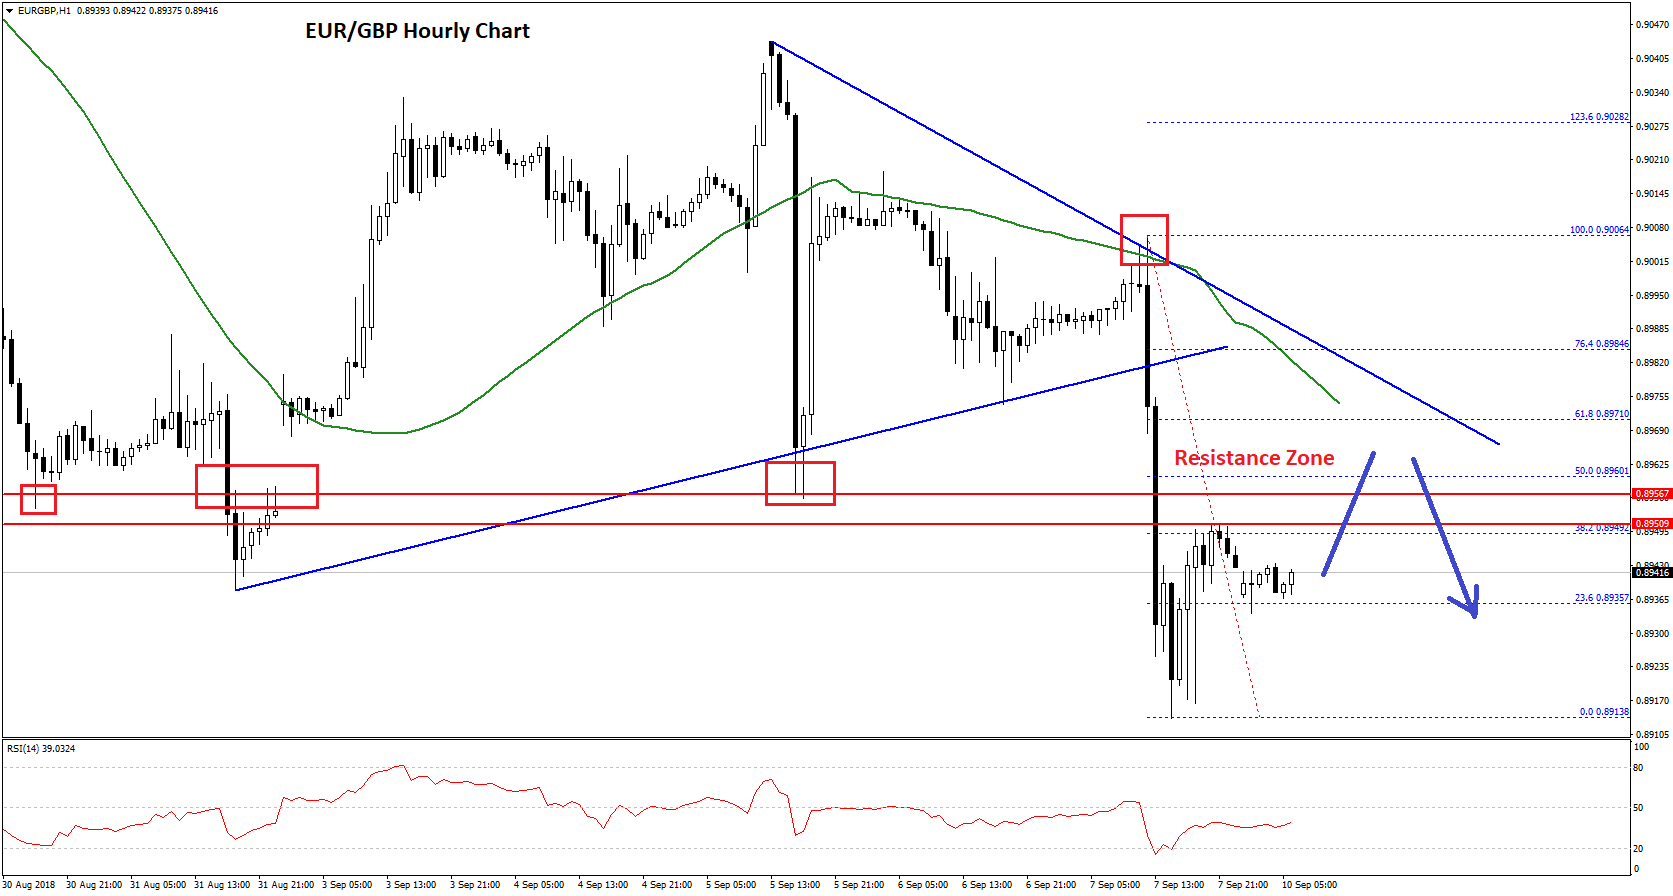
The pair later broke the 0.8950 support and settled below the 50 hourly simple moving average. It traded as low as 0.8913 and is currently correcting higher. Buyers managed to push the pair above the 0.8930 level, but the 38.2% Fib retracement level of the last decline from the 0.9006 high to 0.8913 low near 0.8950 acted as a resistance.
Above 0.8950, the immediate resistance is at 0.8960 followed by the 50% Fib retracement level of the last decline from the 0.9006 high to 0.8913 low. Moreover, there is a major bearish trend line in place with resistance at 0.8970 on the hourly chart.
Therefore, there are many hurdles on the upside near the 0.8950, 0.8960 and 0.8970 levels. Above these, the pair may resume its uptrend towards 0.9000 and 0.9040.
On the flip side, if the pair fails to move above 0.8970, it could decline once more. The key supports on the downside are 0.8915 and 0.8900.
Trade over 50 forex markets 24 hours a day with FXOpen. Take advantage of low commissions, deep liquidity, and spreads from 0.0 pips. Open your FXOpen account now or learn more about trading forex with FXOpen.
This article represents the opinion of the Companies operating under the FXOpen brand only. It is not to be construed as an offer, solicitation, or recommendation with respect to products and services provided by the Companies operating under the FXOpen brand, nor is it to be considered financial advice.
Latest from Forex Analysis
Latest articles

Google Share Price Rose Post-market to a New All-time Record
Yesterday, after the close of the main trading session, a report on activities for the 1st quarter of Alphabet Inc. (Google's parent company) was published. The report was strong, exceeding investors' expectations.
→ Quarterly EPS = USD 1.89 (expected = USD 1.

S&P 500 Rebounds after Negative GDP News
Data released yesterday showed US GDP growth slowed to 1.6% in the first quarter of the year. According to ForexFactory: forecast = 2.2%, past value = 2.4%.
Reaction to the news sent the S&P 500 mini stock

GBP/USD And USD/CAD Daily Chart Outlook
GBP/USD is attempting a recovery wave from 1.2300. USD/CAD is consolidating and might aim for a move above the 1.3760 resistance zone.
Important Takeaways for GBP/USD and USD/CAD Analysis Today
· The British Pound started