


FXOpen
GBP/USD declined recently and broke the 1.3040 support. EUR/GBP is also facing many hurdles and it remains at a risk of more losses in the near term.
Important Takeaways for GBP/USD and EUR/GBP
- The British Pound faced an increased selling pressure and declined below 1.3080 and 1.3040.
- There are two bearish trend lines in place with resistance at 1.3020 and 1.3070 on the hourly chart of GBP/USD.
- EUR/GBP is forming a short-term breakout pattern with resistance at 0.8900 and 0.8910.
- There is a key support on the downside near the 0.8875 level.
GBP/USD Technical Analysis
The British Pound faced a lot of selling interest this past week above the 1.3150 level against the US Dollar. The GBP/USD pair started a major downside move and broke the 1.3100, 1.3080 and 1.3040 support levels.
The downside move was such that the pair even broke the 1.3000 handle and traded as low as 1.2976. Later, the pair corrected higher and traded above the 23.6% Fib retracement level of the last decline from the 1.3125 high to 1.2976 low.
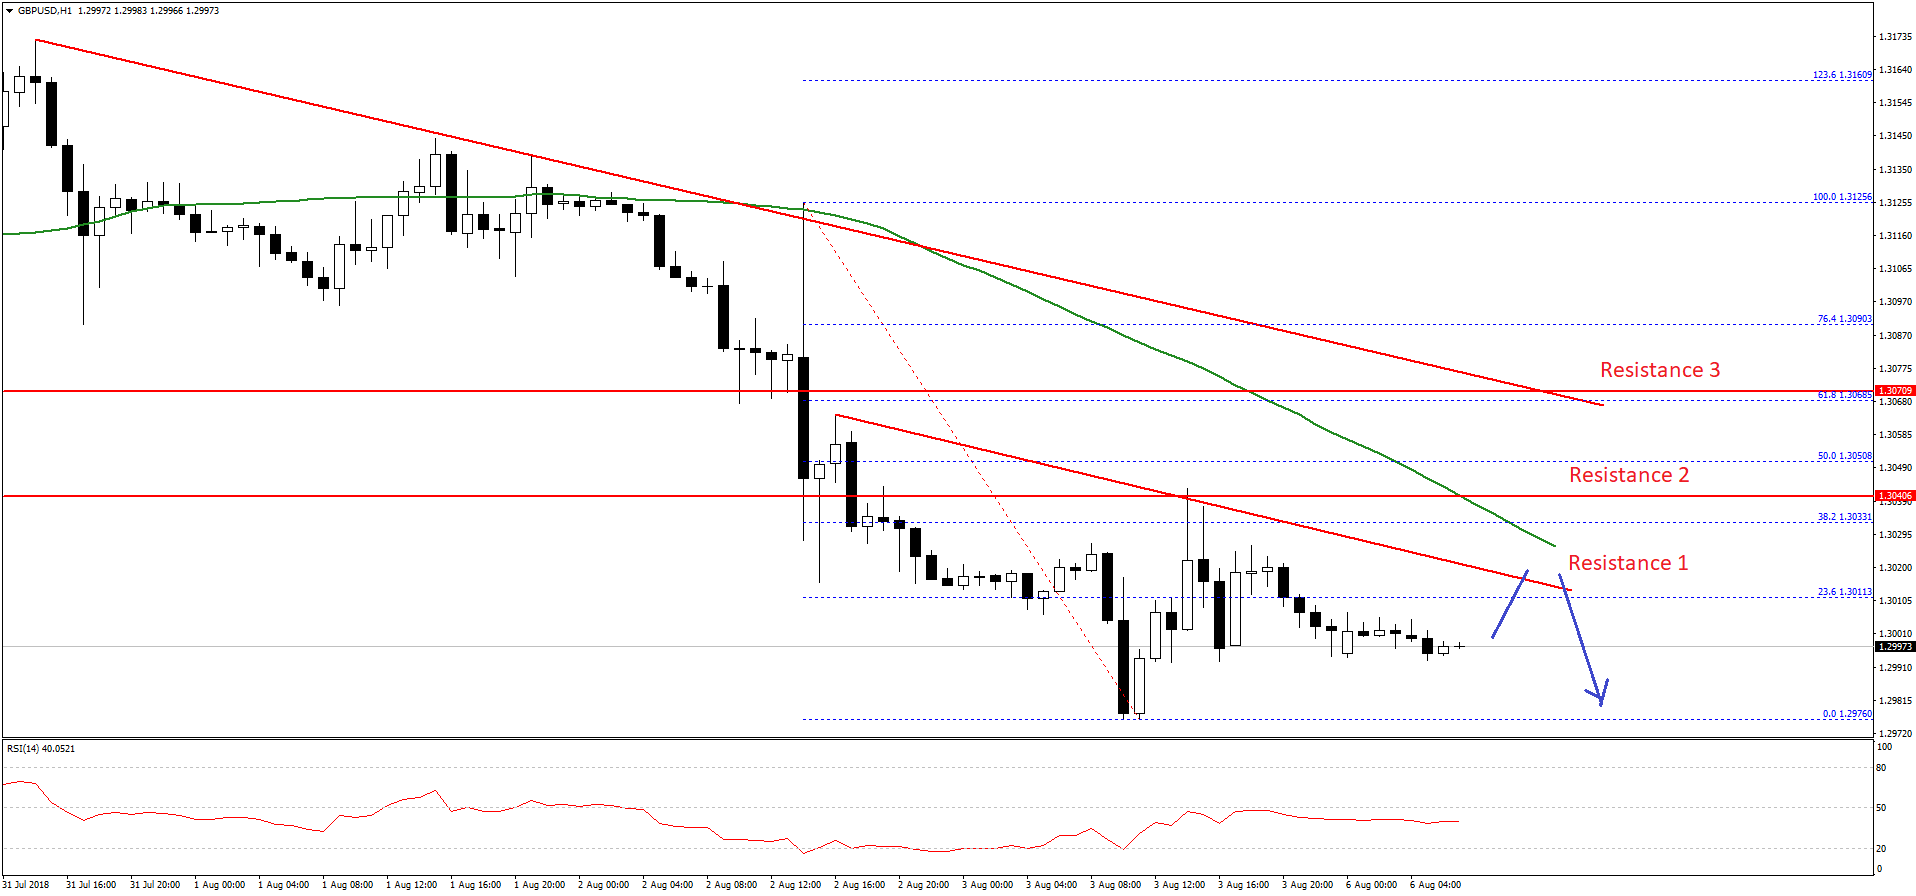
However, gains were contained by the 1.3040 level, which was a support earlier. Moreover, the 38.2% Fib retracement level of the last decline from the 1.3125 high to 1.2976 low also acted as a resistance.
More importantly, there are two bearish trend lines in place with resistance at 1.3020 and 1.3070 on the hourly chart. Above the first trend line, the 50 hourly simple moving average is positioned near 1.3025.
Therefore, if the pair moves higher, it could face a strong selling interest near the 1.3020, 1.3025 and 1.3040 levels. It seems like the pair may continue to move down and it could revisit the last low at 1.2976.
Should there be more losses below the 1.2976 low, the next stop for sellers may well be near the 1.2920 level. On the flip side, if buyers manage to clear the 1.3040 resistance, GBP/USD could recover above the 1.3080 level.
EUR/GBP Technical Analysis
The Euro traded with bullish moved above the 0.8880 level against the British Pound during the past few days. However, the EUR/GBP pair struggled to hold gains above the 0.8920 level and declined.
There were many attempts to gain strength above the 0.8920 level, but buyers failed to push the pair further higher. As a result, there was a downside reaction and the pair declined below the 23.6% Fib retracement level of the last wave from the 0.8854 low to 0.8924 high.
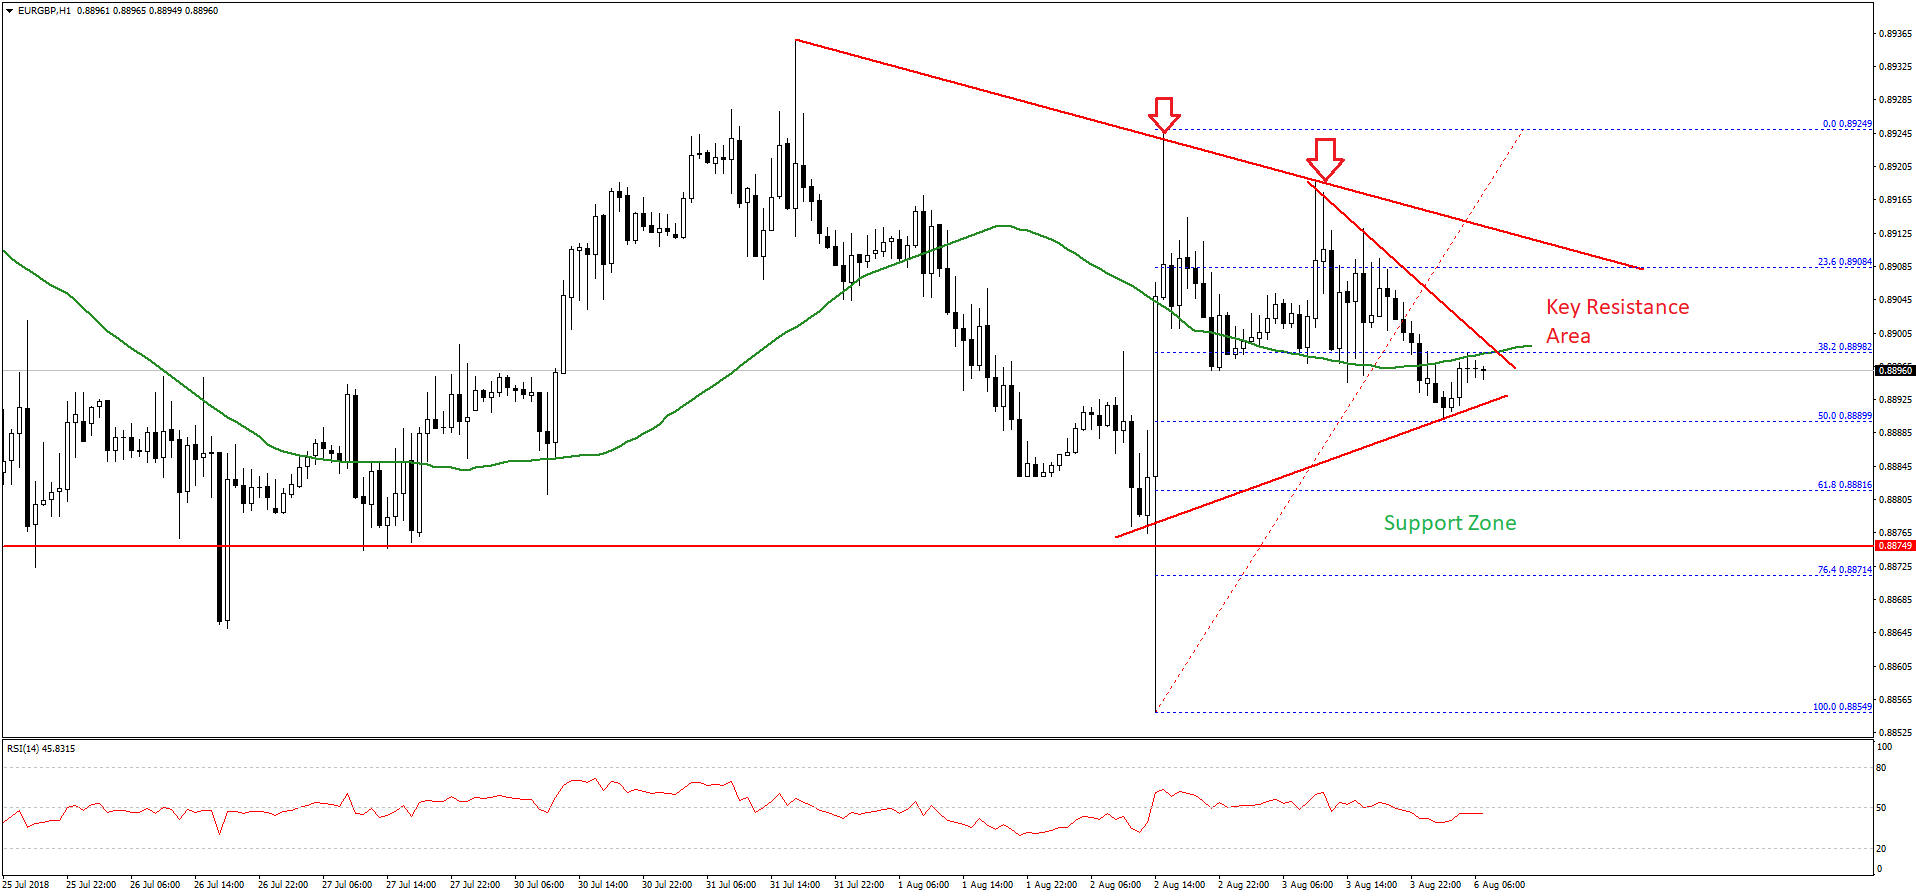
During the decline, the pair broke the 0.8910 support and settled below the 50 hourly SMA. At the moment, the pair is finding bids near the 50% Fib retracement level of the last wave from the 0.8854 low to 0.8924 high.
It may correct higher, but there is a short-term breakout pattern formed with resistance at 0.8905 on the hourly chart. Above this, there is another important resistance near 0.8910 and a bearish trend line on the same chart.
Therefore, if the pair moves higher, it is likely to face many hurdles near the 0.8910 level. Above this, a proper close above 0.8925 level is needed for an upside acceleration. If not, the pair could decline below 0.8890 for an extended slide. The next major support is near the 0.8875 level.
Overall, both GBP/USD and EUR/GBP are currently at a risk of more losses in the near term.
Trade over 50 forex markets 24 hours a day with FXOpen. Take advantage of low commissions, deep liquidity, and spreads from 0.0 pips. Open your FXOpen account now or learn more about trading forex with FXOpen.
This article represents the opinion of the Companies operating under the FXOpen brand only. It is not to be construed as an offer, solicitation, or recommendation with respect to products and services provided by the Companies operating under the FXOpen brand, nor is it to be considered financial advice.
Latest from Forex Analysis
Latest articles

Weekly Market Wrap With Gary Thomson: UK100, USD, GOLD, OIL
Get the latest scoop on the week's hottest headlines, all in one convenient video. Join Gary Thomson, the COO of FXOpen UK, as he breaks down the most significant news reports and shares his expert insights.
- UK100 Share Index Rises

What Is a Darvas Box Theory and How Does It Work in Trading?
The Darvas Box Theory, pioneered by Nicolas Darvas in the 1950s, has transcended its stock market origins to become a valuable tool for forex traders. This method leverages specific price movements and patterns, known as the Darvas Box, to track

NFLX Stock Price Falls Despite Subscriber Growth
Yesterday, after the close of the main trading session on the stock market, Netflix reported to investors for the 1st quarter of 2024.
The report turned out better than expected:
→ earnings per share: actual = USD 5.28, forecast = USD 4.