


FXOpen

GBP/USD failed to clear the key 1.4200 resistance zone and corrected lower. EUR/GBP is rising and it might continue to rise towards the 0.8650 level.
Important Takeaways for GBP/USD and EUR/GBP
- The British Pound failed to gain pace above the main 1.4200 resistance zone.
- There is a key bearish trend line forming with resistance near 1.4175 on the hourly chart of GBP/USD.
- EUR/GBP started a fresh increase after it found a strong support near the 0.8565 zone.
- There was a break above a major bearish trend line with resistance near 0.8590 on the hourly chart.
GBP/USD Technical Analysis
The British Pound started a fresh increase from the 1.4080 support zone against the US Dollar. The GBP/USD pair climbed above the 1.4150 resistance and the 50 hourly simple moving average.
However, the pair failed to gain pace above the 1.4200 resistance. It traded as high as 1.4199 on FXOpen and it is now correcting gains. There was a break below the 1.4165 support level. The bears pushed the pair below the 23.6% Fib retracement level of the upward move from the 1.4083 swing low to 1.4199 high.
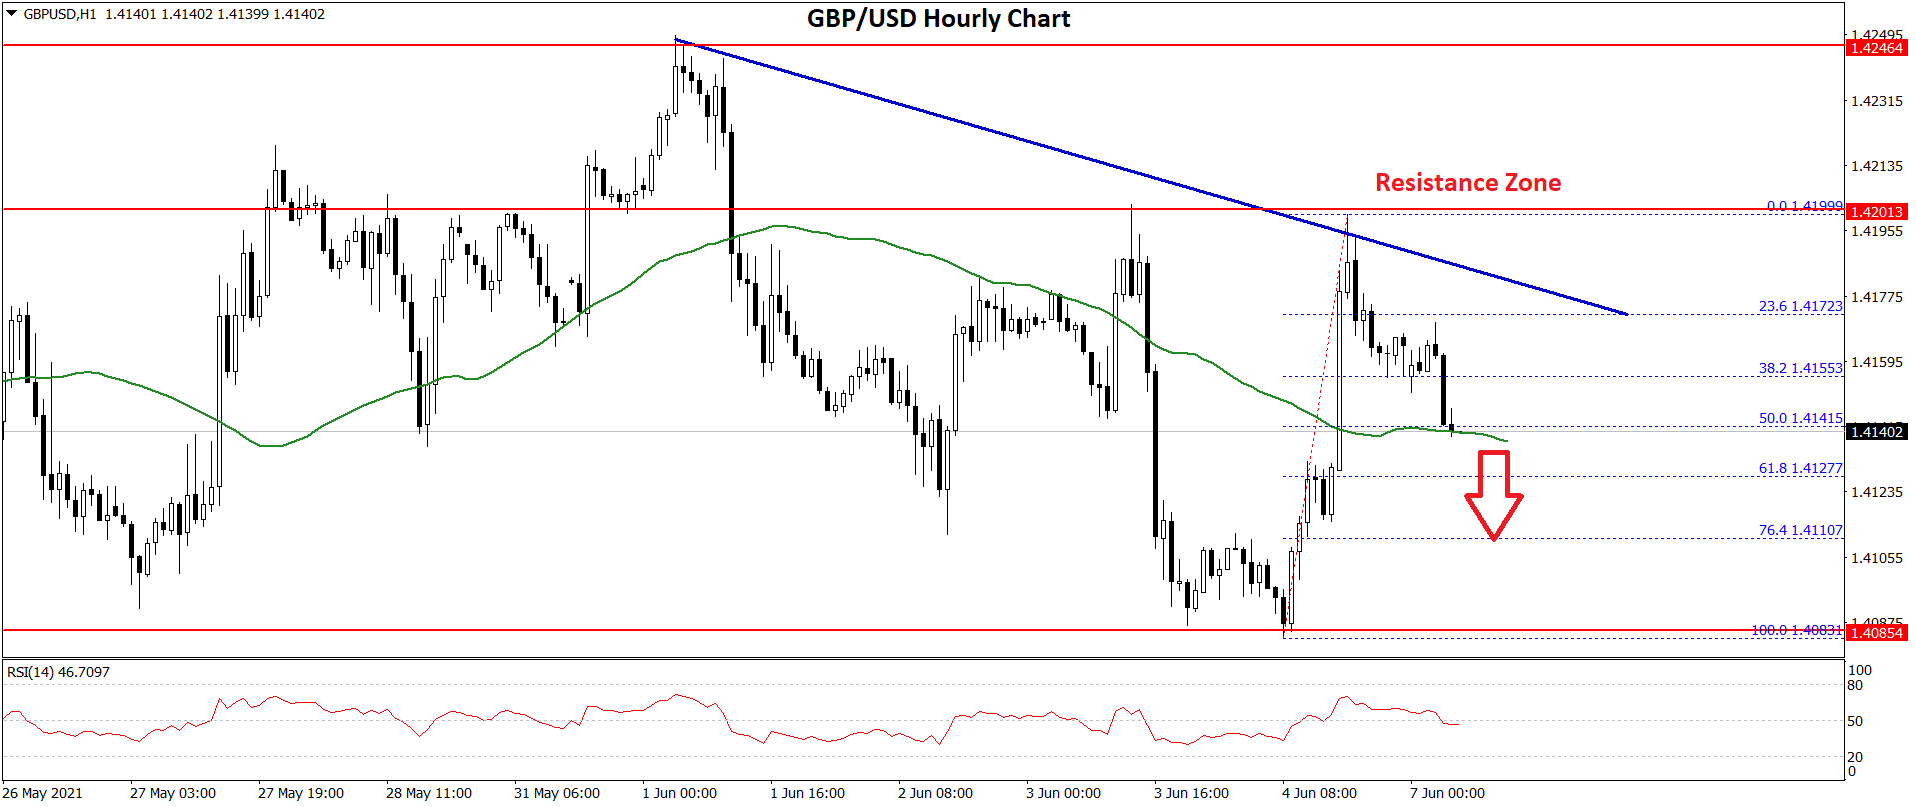
The pair is now testing the 1.4140 level and the 50 hourly simple moving average. It is close to the 50% Fib retracement level of the upward move from the 1.4083 swing low to 1.4199 high.
A downside break below 1.4140 could set the pace for a fresh decline towards the 1.4100 support. The main support is still near 1.4080, below which the pair could dive towards 1.4000.
On the upside, an immediate resistance is near the 1.4170 level. There is also a key bearish trend line forming with resistance near 1.4175 on the hourly chart of GBP/USD. The next major resistance is near the 1.4200 level.
A successful close above 1.4170 and a follow up move above 1.4200 could open the doors for a move towards the 1.4250 resistance.
EUR/GBP Technical Analysis
The Euro declined steadily from the 0.8650 resistance zone against the British Pound. The EUR/GBP pair declined below the 0.8625 support zone to move into a bearish zone.
There was also a break below the 0.8600 support zone and the 50 hourly simple moving average. A low is formed near 0.8564 and the pair is now correcting higher. There was a break above the 0.8580 and 0.8590 resistance levels.
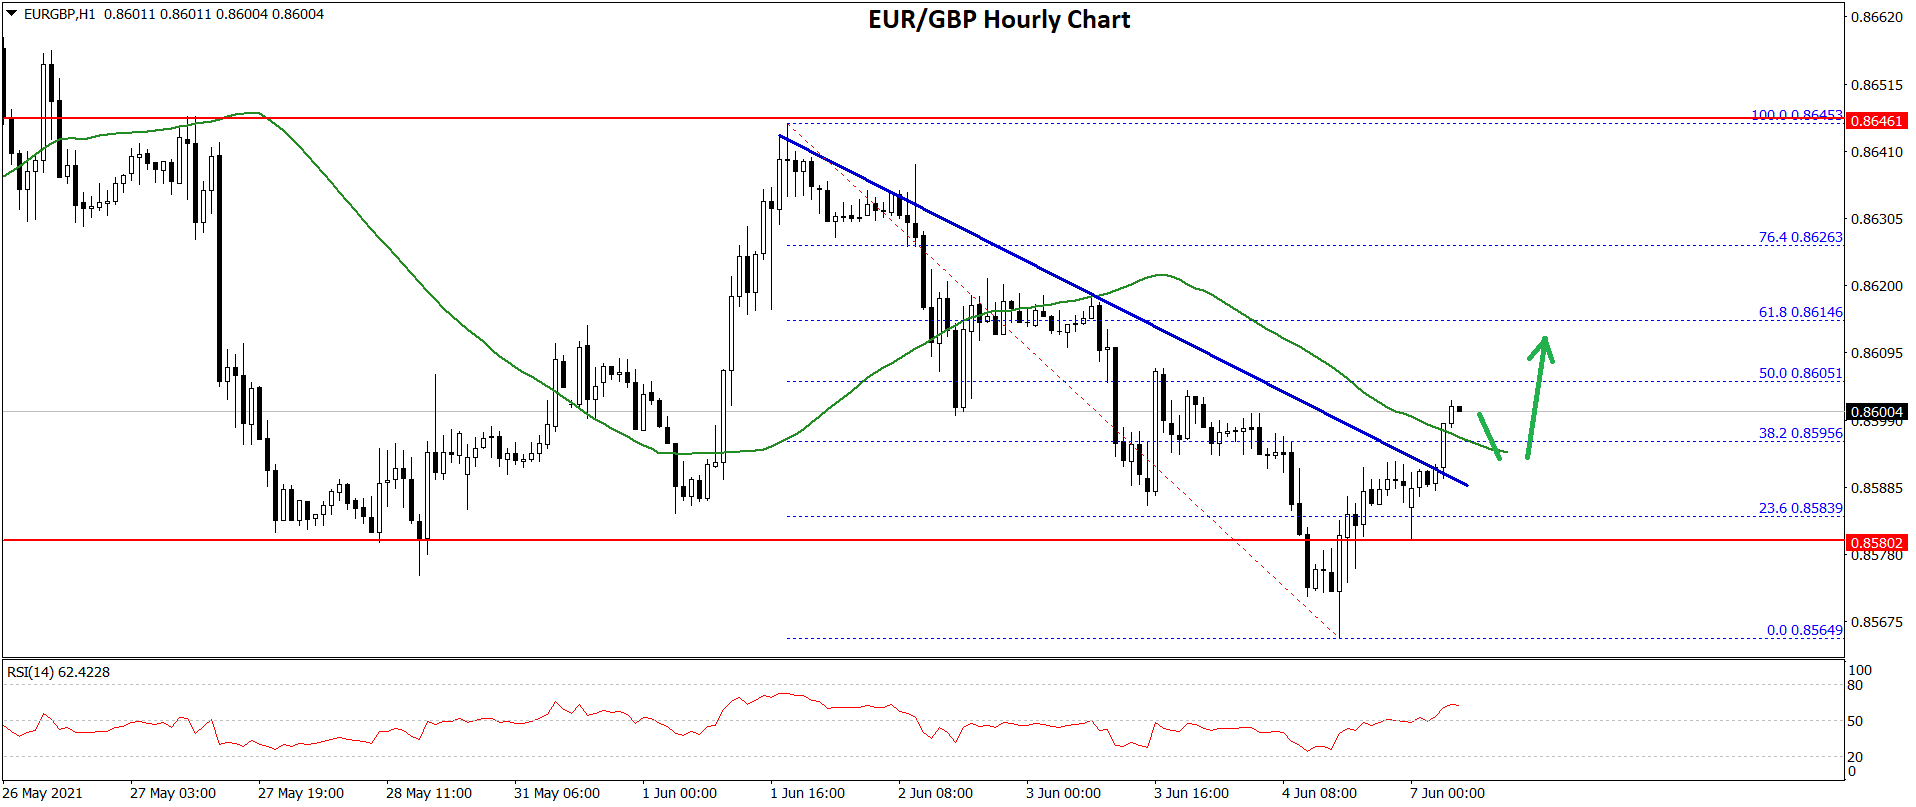
The pair climbed above the 23.6% Fib retracement level of the downward move from the 0.8645 high to 0.8564 low. There was also a break above a major bearish trend line with resistance near 0.8590 on the hourly chart.
The pair is now trading near 0.8600 and it is close to the 50 hourly simple moving average. The next key resistance is near the 0.8605 level.
The 50% Fib retracement level of the downward move from the 0.8645 high to 0.8564 low is also near the 0.8650 level. A close above the 0.8605 level could set the pace for a larger increase. The next major hurdle for the bulls could be 0.8650.
Conversely, the pair could start a fresh decline below the 0.8580 support zone. The key support is still near the 0.8565 level. Any more losses could lead the pair towards the 0.8550 level.
This forecast represents FXOpen Markets Limited opinion only, it should not be construed as an offer, invitation or recommendation in respect to FXOpen Markets Limited products and services or as financial advice.
Trade over 50 forex markets 24 hours a day with FXOpen. Take advantage of low commissions, deep liquidity, and spreads from 0.0 pips. Open your FXOpen account now or learn more about trading forex with FXOpen.
This article represents the opinion of the Companies operating under the FXOpen brand only. It is not to be construed as an offer, solicitation, or recommendation with respect to products and services provided by the Companies operating under the FXOpen brand, nor is it to be considered financial advice.
Latest from Forex Analysis
Latest articles

What Order Imbalance Is and How To Use It in a Trading Strategy
Understanding the nuances of order imbalances is key for traders looking to navigate the ebb and flow of asset prices. Order imbalances provide a clear window into the supply and demand dynamics at play, offering strategic insights. This article delves

XAU/USD Gold Price Reaches an Important Resistance Zone
The XAU/USD gold chart today indicates that the historical record price of the metal is above USD 2,400 per ounce.
In addition to fears of a new round of inflation due to rising commodity prices, geopolitical tensions are

What Is a Break of Structure and How Can You Trade It?
In the ever-evolving world of Smart Money Concept (SMC) trading, a nuanced understanding of market dynamics is indispensable. This article explores the concept of Break of Structure (BOS), how to identify it, and its implications for trading strategies, setting traders