


FXOpen

GBP/USD extended its rise towards 1.3700 before starting a downside correction. EUR/GBP is showing positive signs and it could surge if it breaks the 0.9050 resistance.
Important Takeaways for GBP/USD and EUR/GBP
- The British Pound traded towards the 1.3700 zone, where it faced a strong selling interest.
- There is a key bullish trend line forming with support near 1.3580 on the hourly chart of GBP/USD.
- EUR/GBP started a fresh increase and it broke the 0.9000 resistance zone.
- There is a major bearish trend line in place with resistance near 0.9045 on the hourly chart.
GBP/USD Technical Analysis
In the past few days, there was a steady increase in the British Pound above the 1.3500 resistance zone against the US Dollar. The GBP/USD pair broke the 1.3600 zone to continue higher.
The pair gained momentum above 1.3620 and it even spiked above the 1.3700 resistance. A new multi-month high was formed near 1.3703 on FXOpen before the pair started a downside correction. It traded below the 1.3650 support level and the 50 hourly simple moving average.
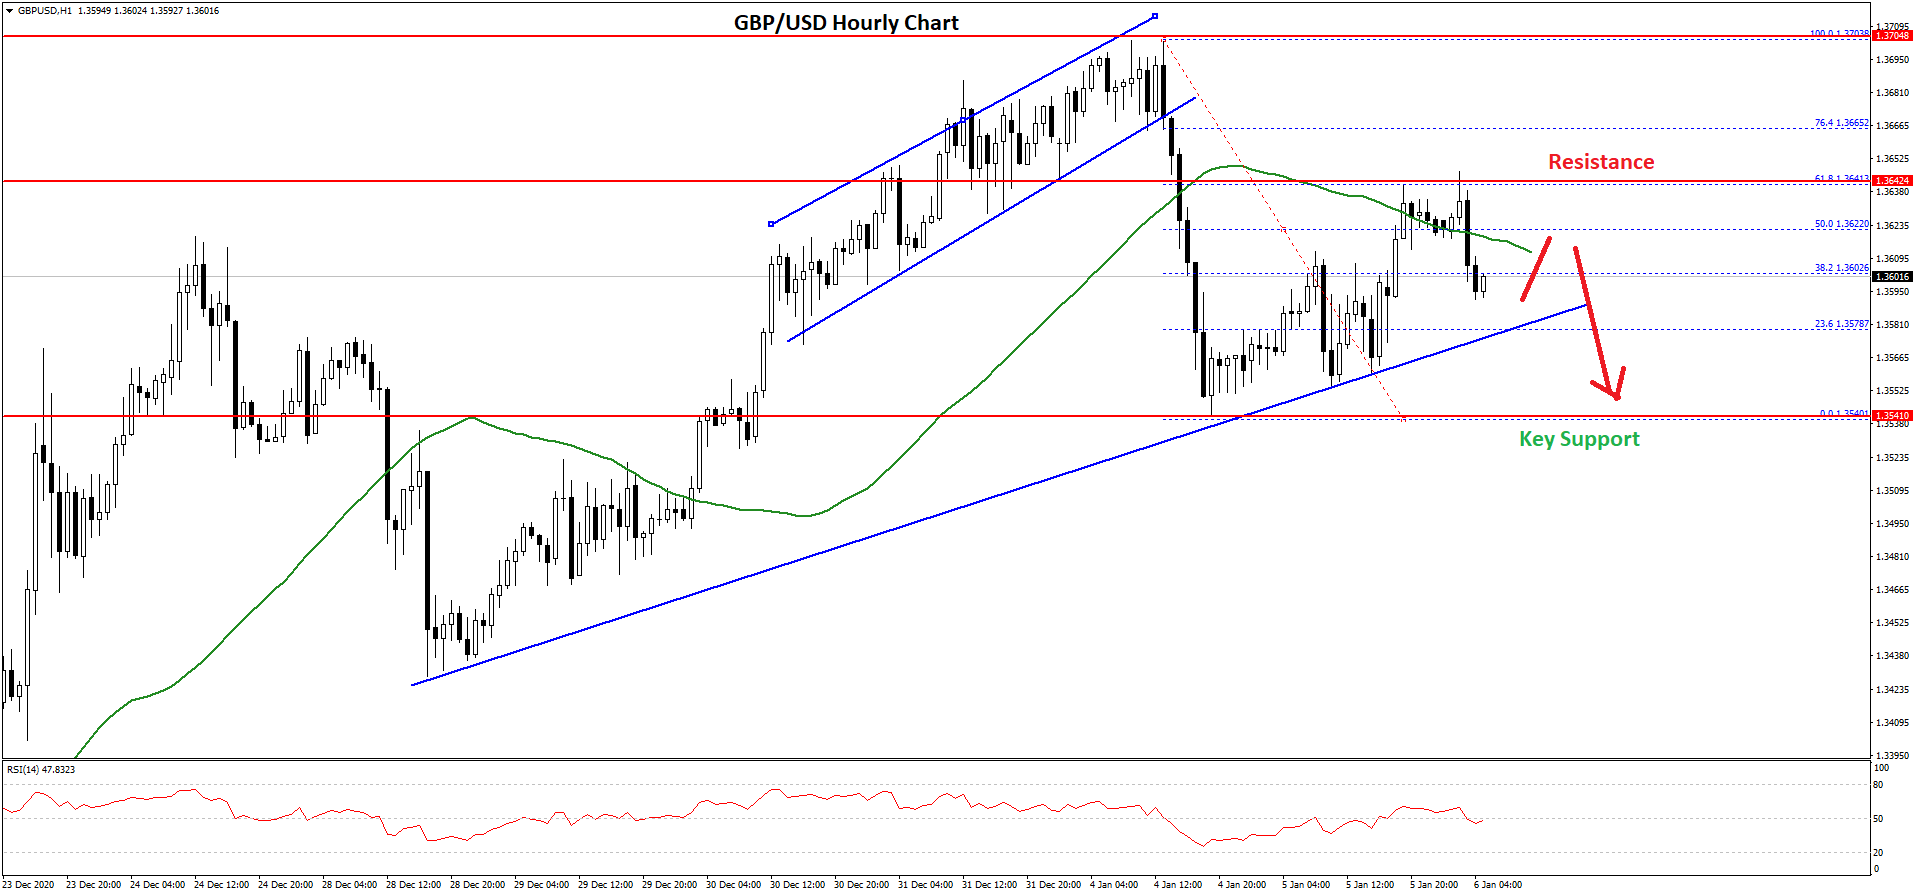
There was a break below a key rising channel with support near 1.3680 on the hourly chart of GBP/USD. It opened the doors for more losses and the pair dived below 1.3600. It traded as low as 1.3540 and it is currently correcting higher.
There was a break above the 50% Fib retracement level of the downward move from the 1.3703 high to 1.3540 low. There is also a key bullish trend line forming with support near 1.3580 on the same chart.
On the upside, the pair is facing a strong resistance near the 1.3620 level, the 50 hourly simple moving average, and the 1.3650 zone. A clear break above the 1.3650 zone is needed for a fresh move towards 1.3700 or even higher.
Conversely, the pair could break the trend line support and continue lower below 1.3580. The next major support is at 1.3540, below which the pair could test the 1.3500 support.
EUR/GBP Technical Analysis
The Euro traded as low as 0.8931 before it started a fresh increase against the British Pound. The EUR/GBP pair broke the 0.8980 and 0.9000 resistance levels to move into a positive zone.
The pair gained pace above 0.9000 and it even settled above the 50 hourly simple moving average. There was a break above the 50% Fib retracement level of the key downward move from the 0.9092 swing high to 0.8931 low.
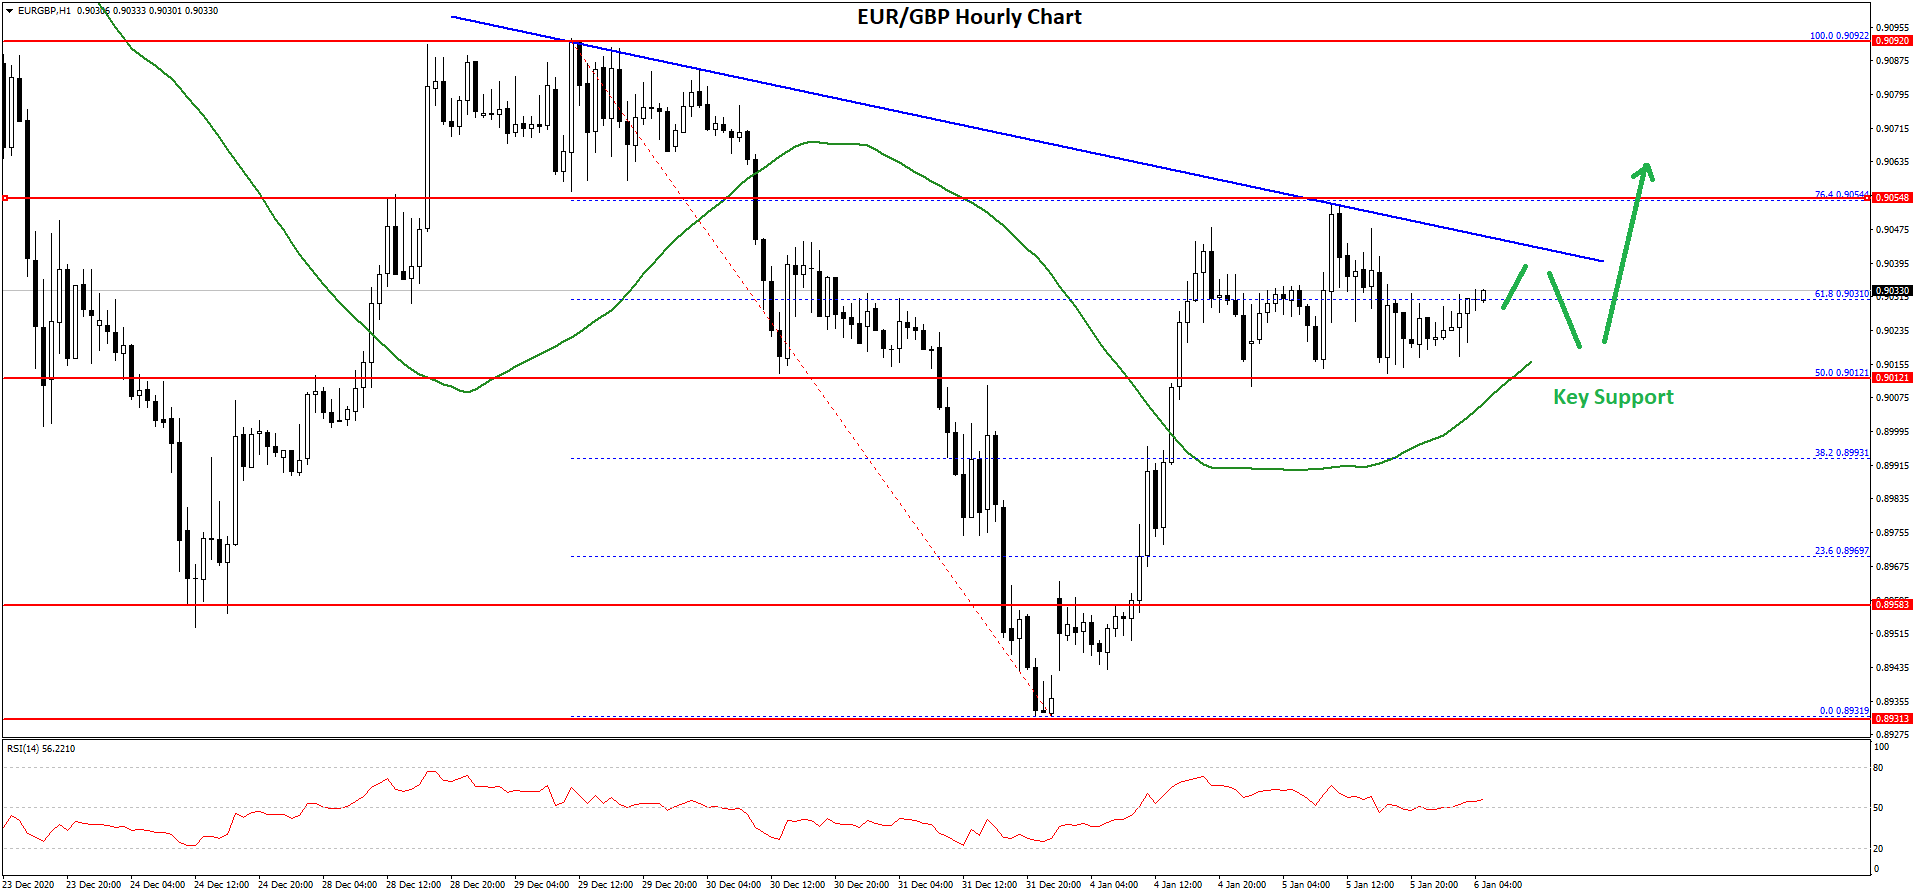
The pair even tested the 0.9050 resistance zone, and the 76.4% Fib retracement level of the key downward move from the 0.9092 swing high to 0.8931 low.
On the upside, there is a major bearish trend line in place with resistance near 0.9045 on the hourly chart. The main resistance is near the 0.9050 level. A clear break above the trend line resistance may possibly increase the chances of a strong rise towards the 0.9100 level.
Conversely, the pair could start a fresh decline. The main support is forming near the 0.9000 area and the 50 hourly SMA. If there is a downside break below the 0.9010 and 0.9000 support levels, the pair could continue to move down towards the 0.8950 level in the near term.
Trade over 50 forex markets 24 hours a day with FXOpen. Take advantage of low commissions, deep liquidity, and spreads from 0.0 pips. Open your FXOpen account now or learn more about trading forex with FXOpen.
This article represents the opinion of the Companies operating under the FXOpen brand only. It is not to be construed as an offer, solicitation, or recommendation with respect to products and services provided by the Companies operating under the FXOpen brand, nor is it to be considered financial advice.
Latest from Forex Analysis
Latest articles

Weekly Market Wrap With Gary Thomson: UK100, USD, GOLD, OIL
Get the latest scoop on the week's hottest headlines, all in one convenient video. Join Gary Thomson, the COO of FXOpen UK, as he breaks down the most significant news reports and shares his expert insights.
- UK100 Share Index Rises

What Is a Darvas Box Theory and How Does It Work in Trading?
The Darvas Box Theory, pioneered by Nicolas Darvas in the 1950s, has transcended its stock market origins to become a valuable tool for forex traders. This method leverages specific price movements and patterns, known as the Darvas Box, to track

NFLX Stock Price Falls Despite Subscriber Growth
Yesterday, after the close of the main trading session on the stock market, Netflix reported to investors for the 1st quarter of 2024.
The report turned out better than expected:
→ earnings per share: actual = USD 5.28, forecast = USD 4.