


FXOpen

GBP/USD settled above the key 1.2650 and 1.2660 support levels, with a positive bias. EUR/GBP started a major downside correction and broke a major support near 0.8960.
Important Takeaways for GBP/USD and EUR/GBP
- The British Pound is trading nicely above the key 1.2660 support area.
- There is a connecting bearish trend line forming with resistance near 1.2718 on the hourly chart of GBP/USD.
- EUR/GBP formed a short term top near the 0.8991 level and recently declined below 0.8980.
- There was a break below a major bullish trend line with support near 0.8958 on the hourly chart.
GBP/USD Technical Analysis
The British Pound started a decent upward move after it broke the 1.2600 resistance area against the US Dollar. As a result, the GBP/USD pair gained momentum above the 1.2620 and 1.2640 levels.
Moreover, there was a close above the key 1.2660 pivot level and the 50 hourly simple moving average. It traded towards the 1.2780 level on FXOpen and recently started a downside correction.
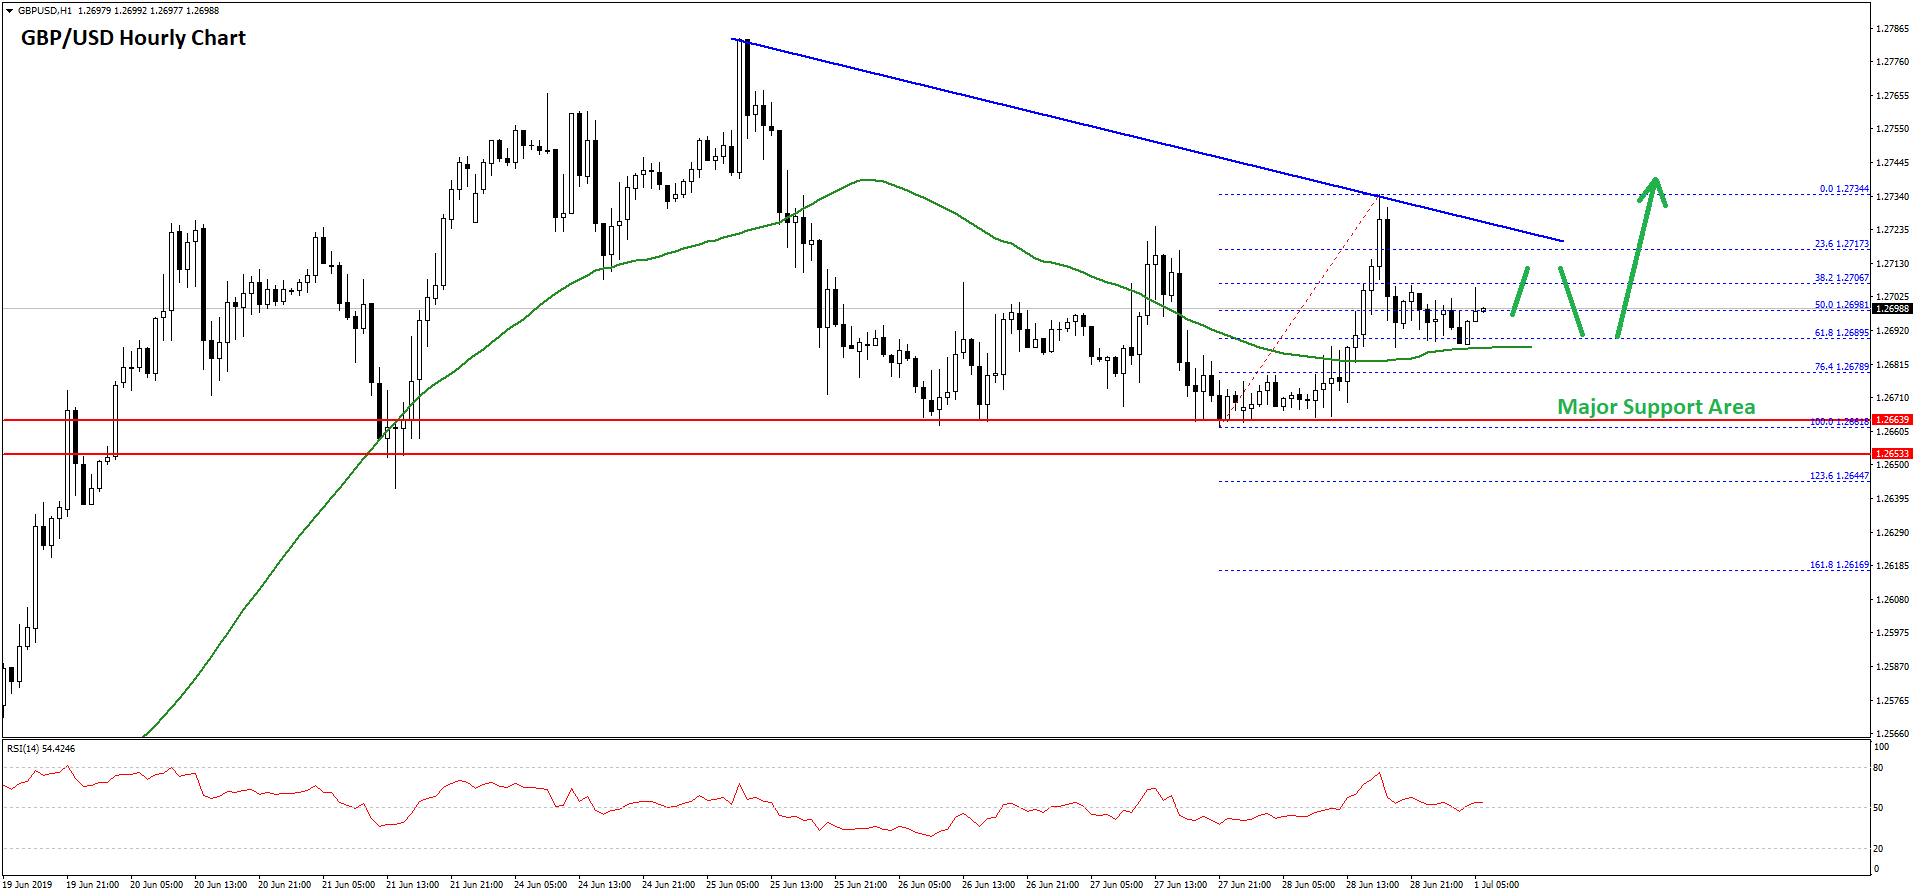
However, the previous resistance near the 1.2650 and 1.2660 levels acted as a strong support. There were many attempts to clear the 1.2650 level, but sellers failed to gain control. The last swing low was near 1.2661 before the price climbed towards the 1.2734 level
It is currently correcting below the 1.2700 level and the 50% Fib retracement level of the last wave from the 1.2661 low to 1.2734 high. However, the 1.2690 level and the 50 hourly simple moving average are acting as a strong support.
Moreover, the 61.8% Fib retracement level of the last wave from the 1.2661 low to 1.2734 high is acting as a support. On the upside, there is a strong resistance forming near 1.2720 and 1.2730.
There is also a connecting bearish trend line forming with resistance near 1.2718 on the hourly chart of GBP/USD. Therefore, a successful break above the trend line and 1.2730 is needed for a fresh increase towards the 1.2780 or 1.2800 level.
On the downside, the main support is near the 1.2650 and 1.2660 levels. If there is a downside break below 1.2650, GBP/USD could decline back towards the 1.2600 support.
EUR/GBP Technical Analysis
The Euro climbed higher steadily this past week and broke the 0.8920 and 0.8950 resistance levels against the British Pound. The EUR/GBP pair even broke the 0.8980 level and traded close to the 0.9000 level.
However, the pair struggled to continue higher and a short term top was formed near the 0.8991 level. Later, the pair started a downside correction below the 0.8980 and 0.8975 levels.
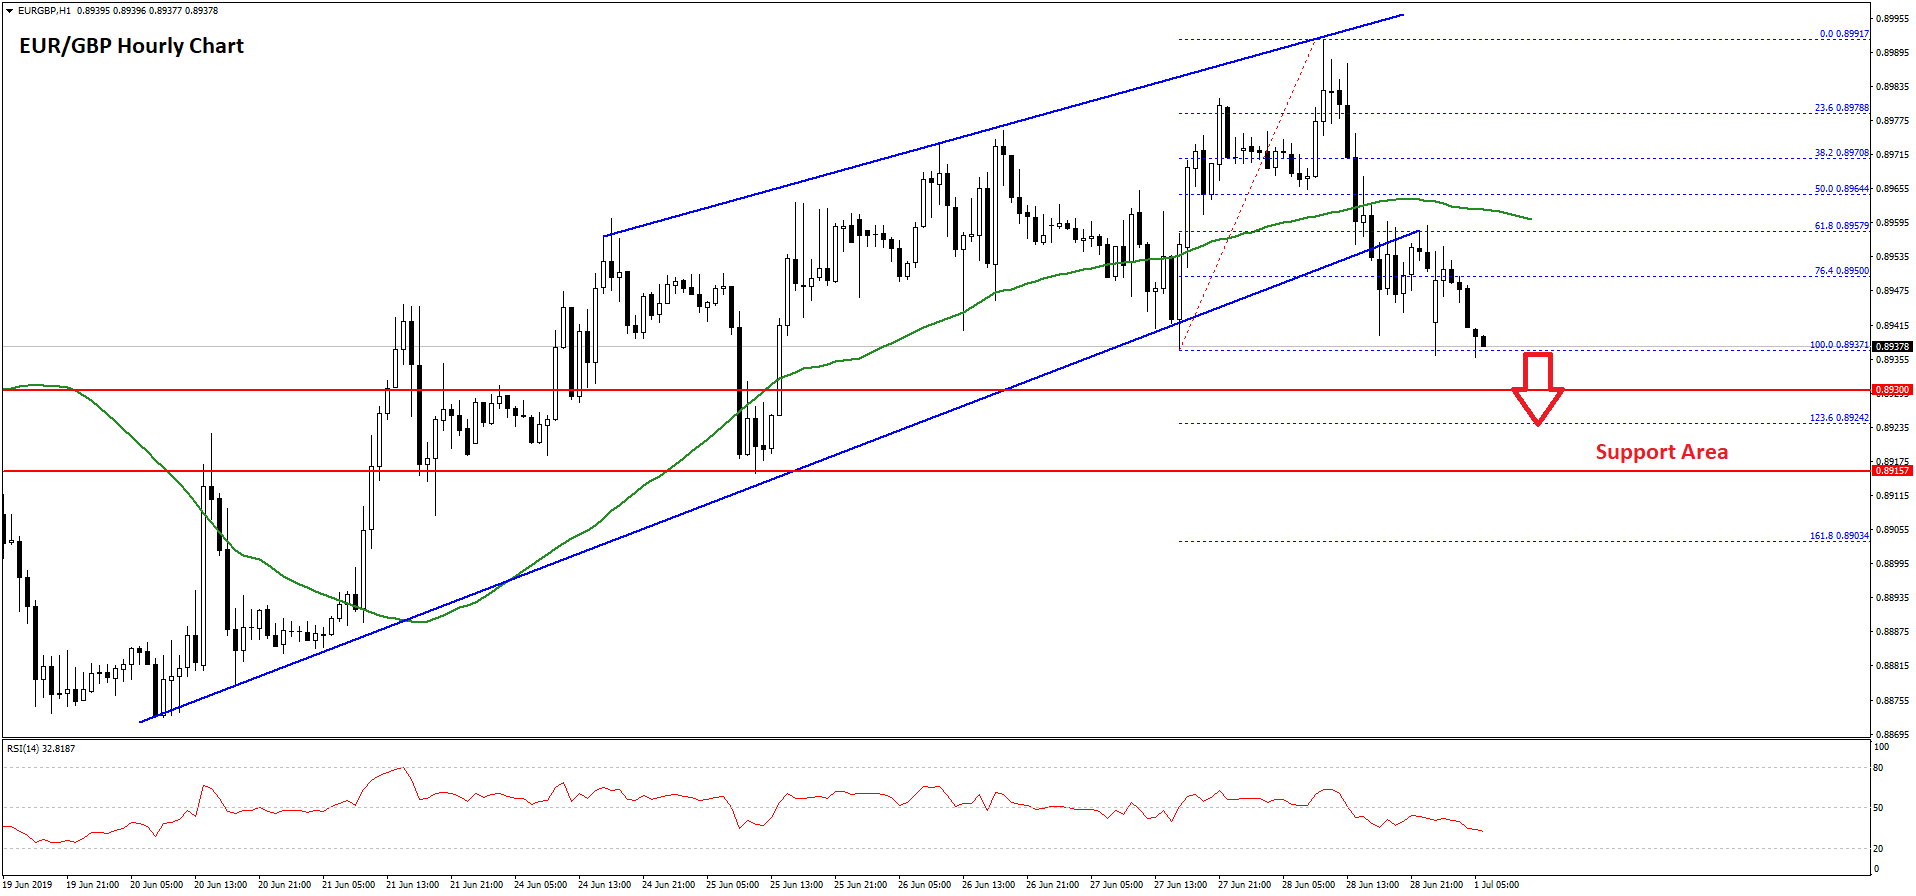
There was a break below a major bullish trend line with support near 0.8958 on the hourly chart. Moreover, the pair broke the 61.8% Fib retracement level of the last wave from the 0.8937 low to 0.8991 high.
Finally, there was a close below 0.8950 and the 50 hourly simple moving average. The price is now trading below the 0.8940 level and it is testing the last swing low.
If there is a downside break, EUR/GBP could slide towards the 0.8930 support or the 1.236 Fib extension level of the last wave from the 0.8937 low to 0.8991 high at 0.8924.
On the upside, there is a strong resistance near the 0.8960 level and the 50 hourly SMA. A successful close above 0.8960 might start a fresh increase towards the 0.9000 level.
Trade over 50 forex markets 24 hours a day with FXOpen. Take advantage of low commissions, deep liquidity, and spreads from 0.0 pips. Open your FXOpen account now or learn more about trading forex with FXOpen.
This article represents the opinion of the Companies operating under the FXOpen brand only. It is not to be construed as an offer, solicitation, or recommendation with respect to products and services provided by the Companies operating under the FXOpen brand, nor is it to be considered financial advice.
Latest from Forex Analysis
Latest articles

What Is a Darvas Box Theory and How Does It Work in Trading?
The Darvas Box Theory, pioneered by Nicolas Darvas in the 1950s, has transcended its stock market origins to become a valuable tool for forex traders. This method leverages specific price movements and patterns, known as the Darvas Box, to track

NFLX Stock Price Falls Despite Subscriber Growth
Yesterday, after the close of the main trading session on the stock market, Netflix reported to investors for the 1st quarter of 2024.
The report turned out better than expected:
→ earnings per share: actual = USD 5.28, forecast = USD 4.

Escalation Between Iran and Israel: How the Price of Brent Oil Reacts
On the night of Thursday into Friday, reports emerged that Israel had attacked Iran following Iran's attack on Israel over the weekend.
Let's remember that we wrote on Monday that after a 300 drone and missile attack on Israel over