


FXOpen
GBP/USD started a strong recovery from the 1.2080 support and climbed above 1.2250. EUR/GBP is currently following a bearish path and is trading below the 0.9120 resistance.
Important Takeaways for GBP/USD and EUR/GBP
- The British Pound managed to bounce back above the 1.2100 and 1.2200 resistance levels.
- There is a major bullish trend line forming with support near 1.2200 on the hourly chart of GBP/USD.
- EUR/GBP started a strong downward move and broke the key 0.9200 and 0.9150 supports.
- There is a key bearish trend line forming with resistance near 0.9100 on the hourly chart.
GBP/USD Technical Analysis
The British Pound formed a strong support above the 1.2050 and 1.2060 levels against the US Dollar. As a result, the GBP/USD pair started a decent recovery and climbed above the 1.2100 and 1.2200 resistance levels.
Moreover, there was a close above the 1.2220 level and the 50 hourly simple moving average. It opened the doors for more gains above the 1.2250 and 1.2270 levels. A swing high was formed near 1.2293 on FXOpen and the pair is currently correcting gains.
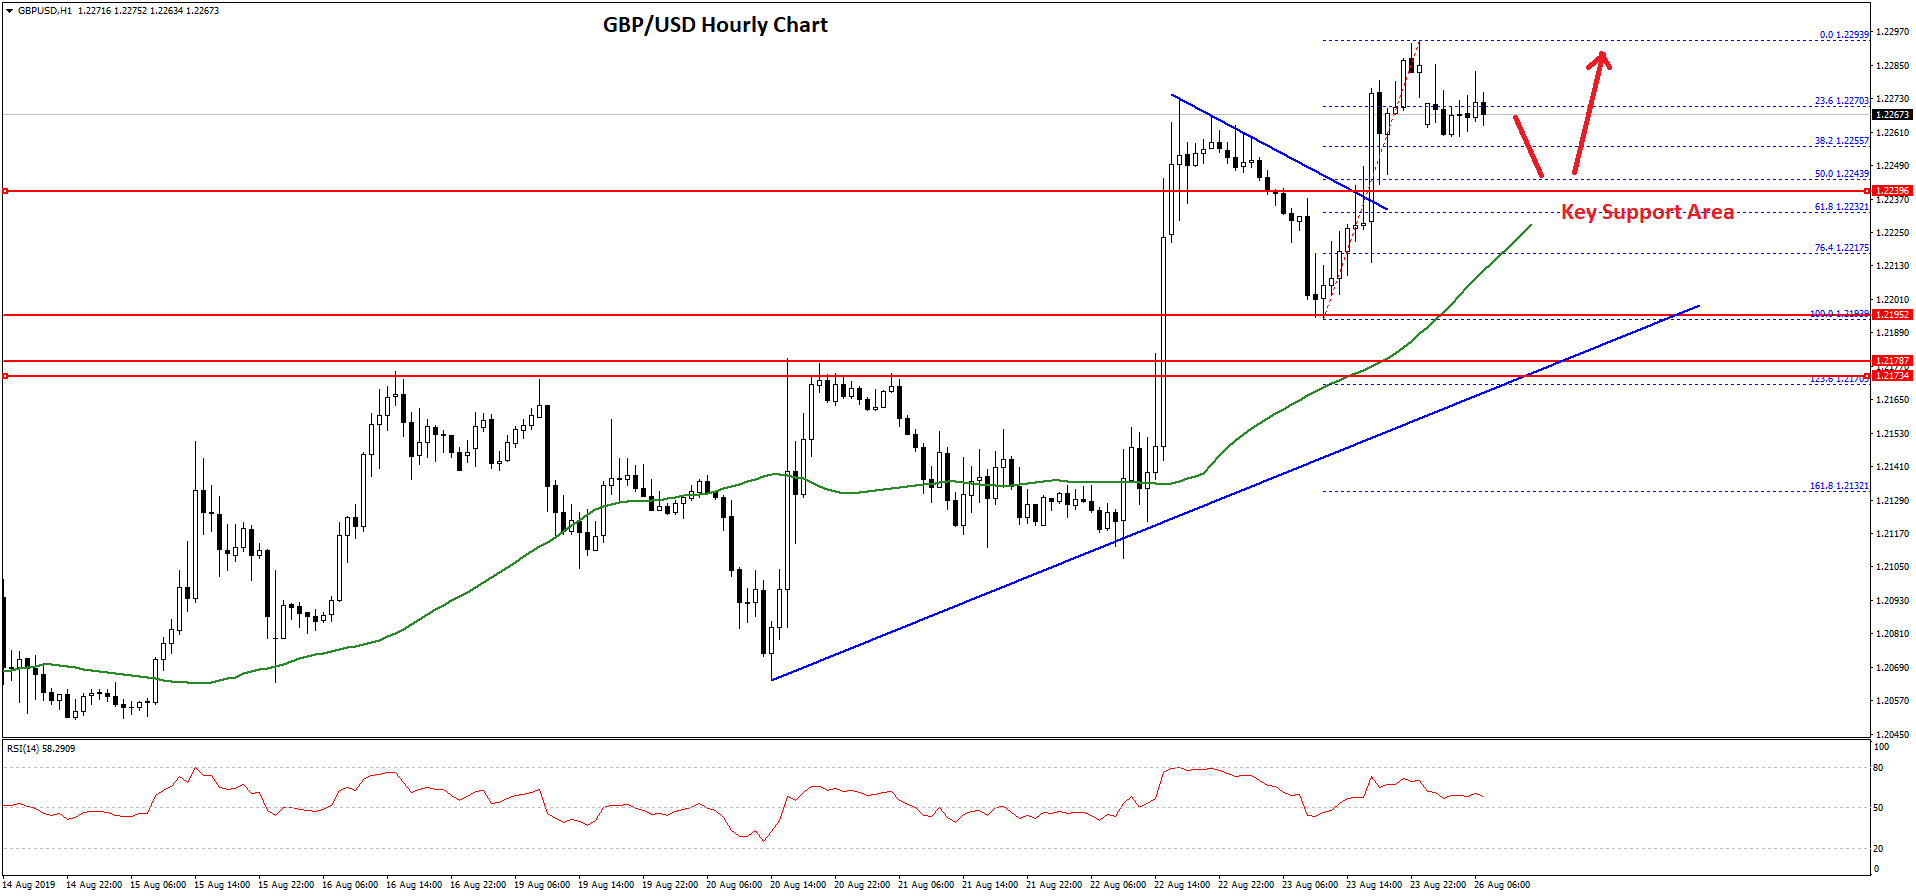
It traded below the 1.3270 level plus the 23.6% Fib retracement level of the recent wave from the 1.2192 low to 1.2293 high. On the downside, there are many supports near the 1.2250 and 1.2240 levels.
The next key support is near the 1.2220 level and the 50 hourly simple moving average. Moreover, the 50% Fib retracement level of the recent wave from the 1.2192 low to 1.2293 high is also near the 1.3240 level.
More importantly, there is a major bullish trend line forming with support near 1.2200 on the hourly chart of GBP/USD. Therefore, a downside correction towards the 1.2220 and 1.2200 levels could find a strong buying interest.
On the upside, an immediate resistance is near the 1.2280 level, above which there are chances of more gains in GBP/USD above the 1.2300 resistance area.
EUR/GBP Technical Analysis
The Euro started a significant downward move from the 0.9280 resistance against the British Pound. The EUR/GBP pair broke the key 0.9200 and 0.9150 support levels to enter a short term bearish zone.
Moreover, there was a break below the 0.9100 support and close below the 50 hourly simple moving average. The pair declined close to the 0.9020 support and traded as low as 0.9028.
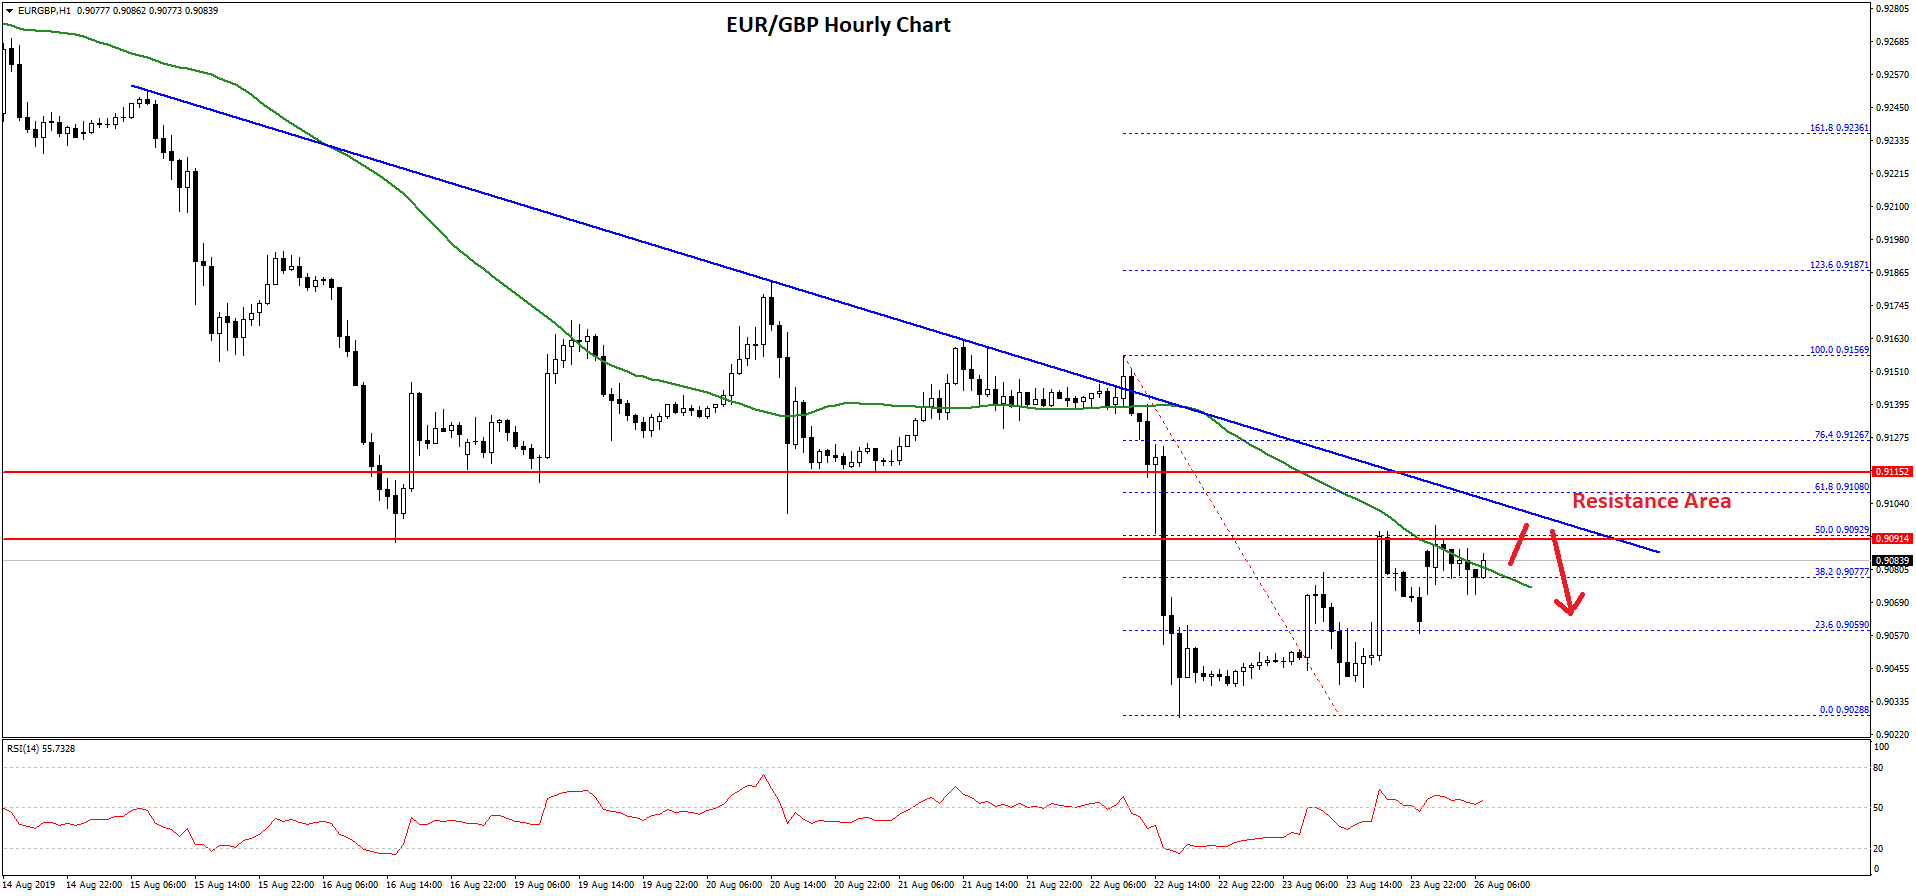
Recently, the pair started an upside correction above the 0.9050 level and the 23.6% Fib retracement level of the decline from the 0.9156 high to 0.9028 low. However, the pair is facing hurdles near the 0.9100 level.
It seems like the 50% Fib retracement level of the decline from the 0.9156 high to 0.9028 low is acting as a strong resistance. Moreover, there is a key bearish trend line forming with resistance near 0.9100 on the hourly chart.
If there is an upside break and close above 0.9100, EUR/GBP could start a strong upward move towards the 0.9200 resistance. An intermediate resistance is near the 0.9150 level.
On the other hand, if there is no break above the 0.9100 resistance, the pair could resume its decline. An immediate support is near the 0.9060 and 0.9050 levels. If there are more losses, the pair could even decline below the 0.9028 swing low in the near term.
Trade over 50 forex markets 24 hours a day with FXOpen. Take advantage of low commissions, deep liquidity, and spreads from 0.0 pips. Open your FXOpen account now or learn more about trading forex with FXOpen.
This article represents the opinion of the Companies operating under the FXOpen brand only. It is not to be construed as an offer, solicitation, or recommendation with respect to products and services provided by the Companies operating under the FXOpen brand, nor is it to be considered financial advice.
Latest from Forex Analysis
Latest articles

The Price of Gold XAU/USD Shows Strongest Fall in Almost 2 Years
On Monday, the price of gold fell from USD 2,386 to USD 2,333 per ounce — this is the strongest drop in one day in almost 2 years, according to Bloomberg. On Tuesday morning in the Asian session, the

Hong Kong-listed Chinese Insurer Goes on Rally as Western Giants Retract
The Asia Pacific region has once again become an area of great interest to investors and traders as some remarkable patterns of volatility have begun to make their presence felt.
This morning, a few examples of Hong Kong-listed Chinese companies

Bitcoin Price Bullish after Halving-2024
On April 19, 2024, a halving occurred in the Bitcoin network, resulting in the reward for the mined block amounting to 3.125 BTC.
Historically, after the halving (which is associated with a reduction in supply), the price of Bitcoin