


FXOpen
GBP/USD topped near the 1.2640 level and started a fresh decline below 1.2550. EUR/GBP is showing positive signs and it could rise further above 0.8800.
Important Takeaways for GBP/USD and EUR/GBP
- The British Pound struggled to stay above 1.2600 and it declined below the 1.2500 level.
- The bears are attempting a downside break below a key bullish trend line with support at 1.2445 on the hourly chart of GBP/USD.
- EUR/GBP is trading nicely above the 0.8750 and 0.8770 support levels.
- There was a break above a major bearish trend line with resistance near 0.8730 on the hourly chart.
GBP/USD Technical Analysis
This past week, the British Pound climbed higher nicely above the 1.2550 and 1.2600 resistance levels against the US Dollar. However, the GBP/USD pair failed to continue higher above 1.2640 and started a fresh decline.
A high was formed near 1.2640 on FXOpen before the pair started a fresh decline. It broke the 1.2600 and 1.2550 support levels. Besides, there was a close below the 1.2520 level and the 50 hourly simple moving average.
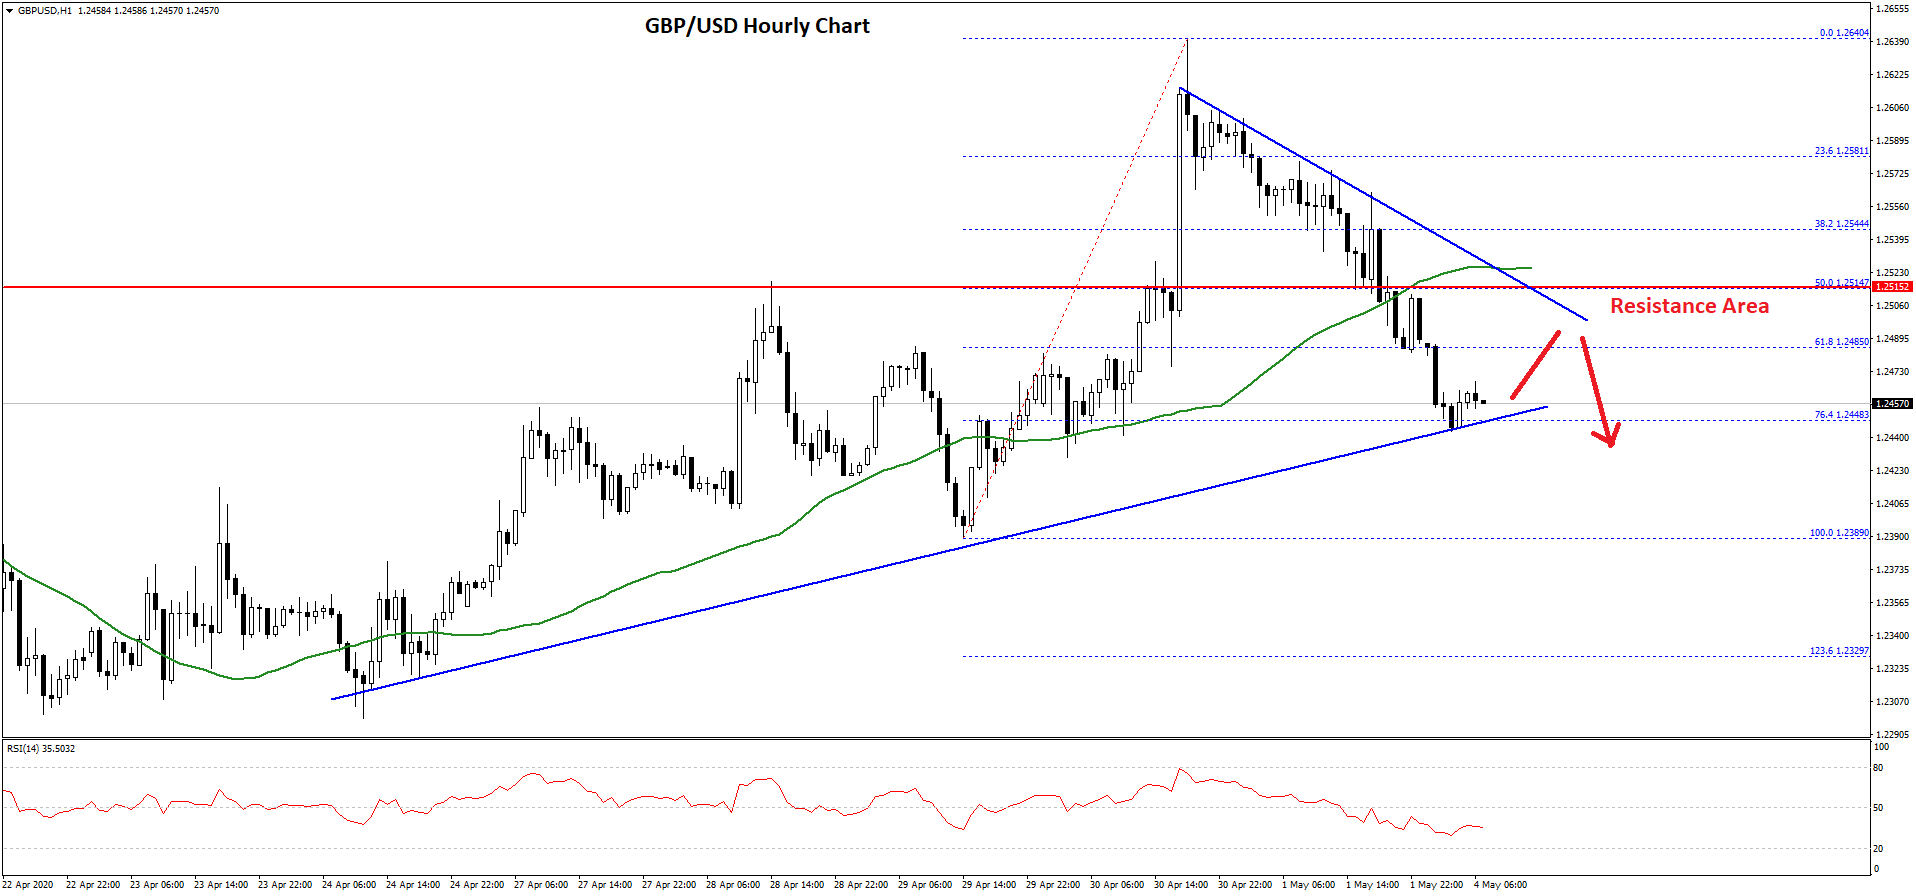
The pair is now trading well below the 61.8% Fib retracement level of the upward move from the 1.2389 low to 1.2640 high. At the moment, the bears are attempting a downside break below a key bullish trend line with support at 1.2445 on the hourly chart of GBP/USD.
The 76.4% Fib retracement level of the upward move from the 1.2389 low to 1.2640 high is also near 1.2448. Therefore, a downside break below the 1.2445 and 1.2440 support levels could open the doors for a larger decline in the near term.
The next key support is near the 1.2320 and 1.2310 levels. On the upside, there are many hurdles forming near the 1.2500 and 1.2515 levels. There is also a connecting bearish trend line forming with resistance near 1.2515 on the same chart.
Therefore, the pair must surpass the 1.2515 resistance area to start a strong recovery in the near term towards 1.2550 and 1.2600.
EUR/GBP Technical Analysis
The Euro followed a strong bullish path above the 0.8700 and 0.8720 resistance levels against the British Pound. The EUR/GBP pair even broke the 0.8735 pivot level to move into a bullish zone.
During the recent rise, there was a break above a major bearish trend line with resistance near 0.8730 on the hourly chart. The pair is now trading nicely above the 0.8750 resistance area and the 50 hourly simple moving average.
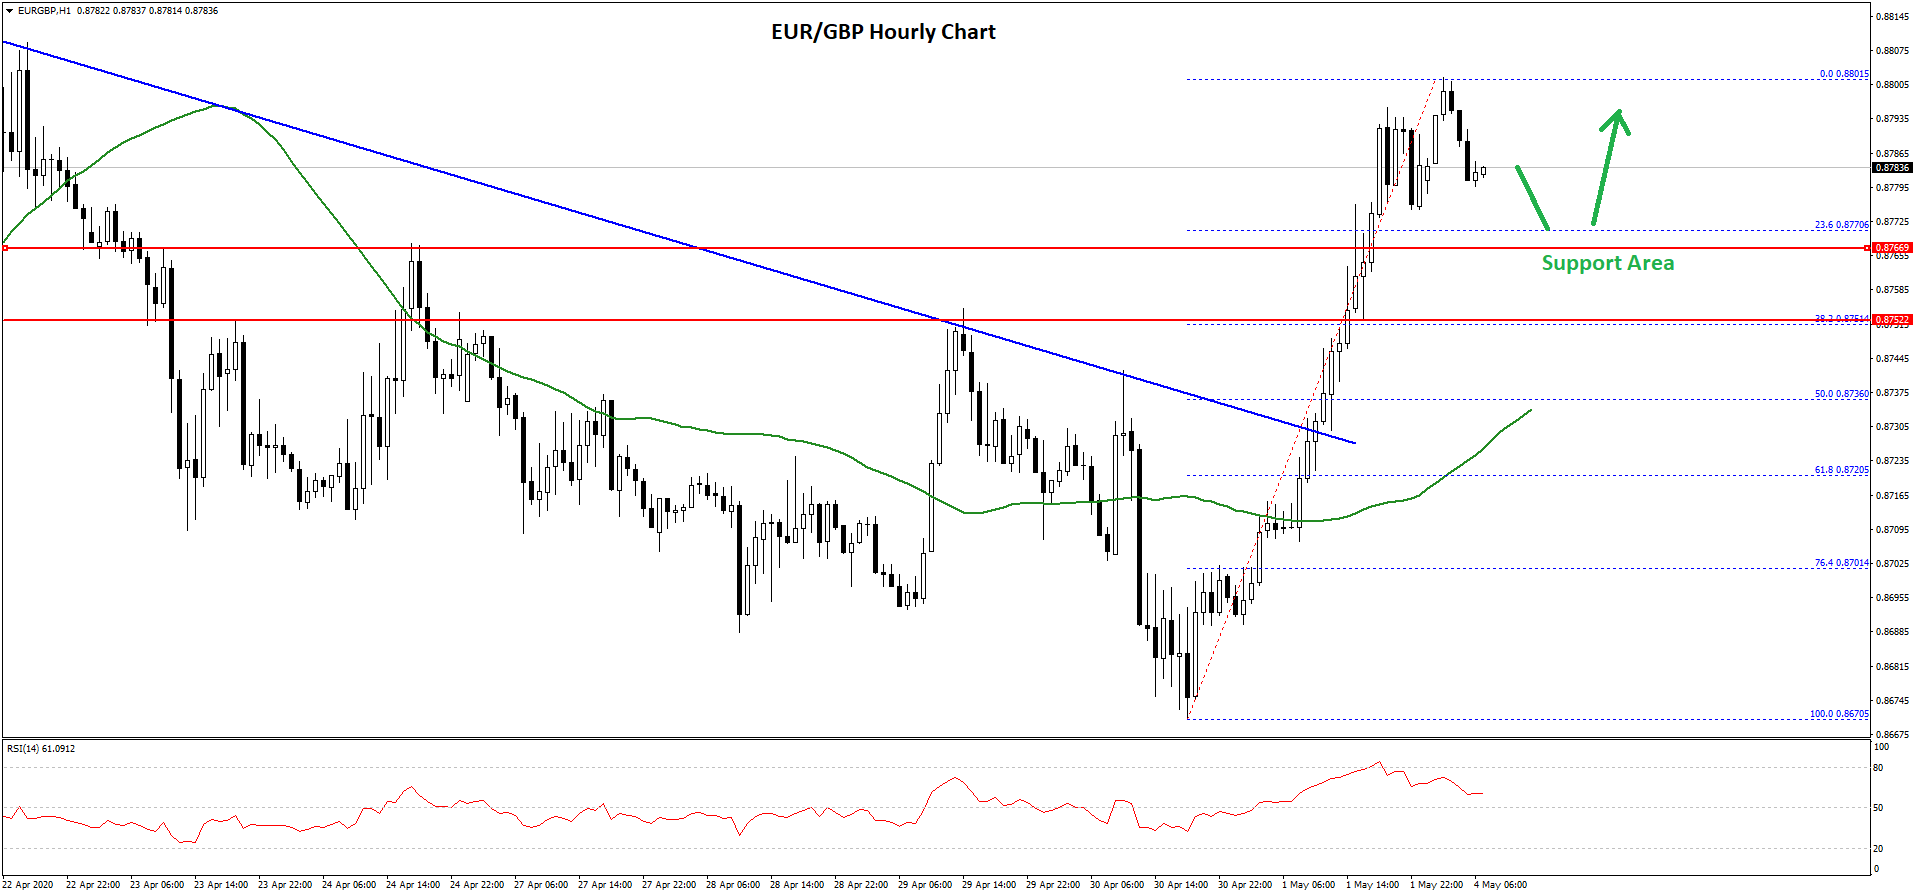
It traded as high as 0.8800 recently and it is currently correcting lower. An initial support on the downside is seen near the 0.8770 level.
The 23.6% Fib retracement level of the recent wave from the 0.8670 low to 0.8800 high is also near the 0.8770 level to provide support. The first key support on the downside is near the 0.8750 level.
The next major support is near the 0.8735 level and the 50 hourly simple moving average. It is close to the 50% Fib retracement level of the recent wave from the 0.8670 low to 0.8800 high.
On the upside, EUR/GBP is facing hurdles near the 0.8800 handle, above which the bulls are likely to aim a larger rally towards the 0.8850 level.
Trade over 50 forex markets 24 hours a day with FXOpen. Take advantage of low commissions, deep liquidity, and spreads from 0.0 pips. Open your FXOpen account now or learn more about trading forex with FXOpen.
This article represents the opinion of the Companies operating under the FXOpen brand only. It is not to be construed as an offer, solicitation, or recommendation with respect to products and services provided by the Companies operating under the FXOpen brand, nor is it to be considered financial advice.
Latest from Forex Analysis
Latest articles

Anchored VWAP and How You Can Use It in Forex Trading
In the world of forex trading, understanding the nuanced tools at your disposal can significantly enhance decision-making processes. One such sophisticated tool is the Anchored Volume-Weighted Average Price (Anchored VWAP), which refines the standard VWAP by allowing traders to set

META Share Price Collapses after Publication of Quarterly Report
Just yesterday, META's stock price closed at USD 493.50, up approximately 40% since the start of 2024 and up nearly 300% since the start of 2023.
However, following the release of Meta's quarterly report, its shares plummeted to USD

USD/JPY Analysis: The Rate Exceeds The Level of 155 Yen Per US Dollar
Today, the price of USD/JPY once again renewed its 34-year high, exceeding the level of 155 yen per dollar, which put pressure on the current authorities.
According to Reuters, officials are trying to maintain calm in the market.
"We