


FXOpen

GBP/USD started a strong increase above the 1.2560 resistance and climbed above 1.2620. EUR/GBP declined steadily and it is now facing hurdles near 0.8965.
Important Takeaways for GBP/USD and EUR/GBP
- The British Pound gained bullish momentum above the 1.2560 and 1.2600 levels.
- There is a key bullish trend line forming with support near 1.2625 on the hourly chart of GBP/USD.
- EUR/GBP started a major downward move below the 0.9000 support zone.
- There are two bearish trend lines forming with resistance near 0.8965 on the hourly chart.
GBP/USD Technical Analysis
In the past few days, the British Pound followed a bullish path above the 1.2560 resistance level against the US Dollar. The GBP/USD pair remained in a nice uptrend and climbed above the 1.2600 pivot level.
Finally, the pair surpassed the 1.2620 resistance and settled nicely above the 50 hourly simple moving average. It traded as high as 1.2665 on FXOpen and recent corrected lower.
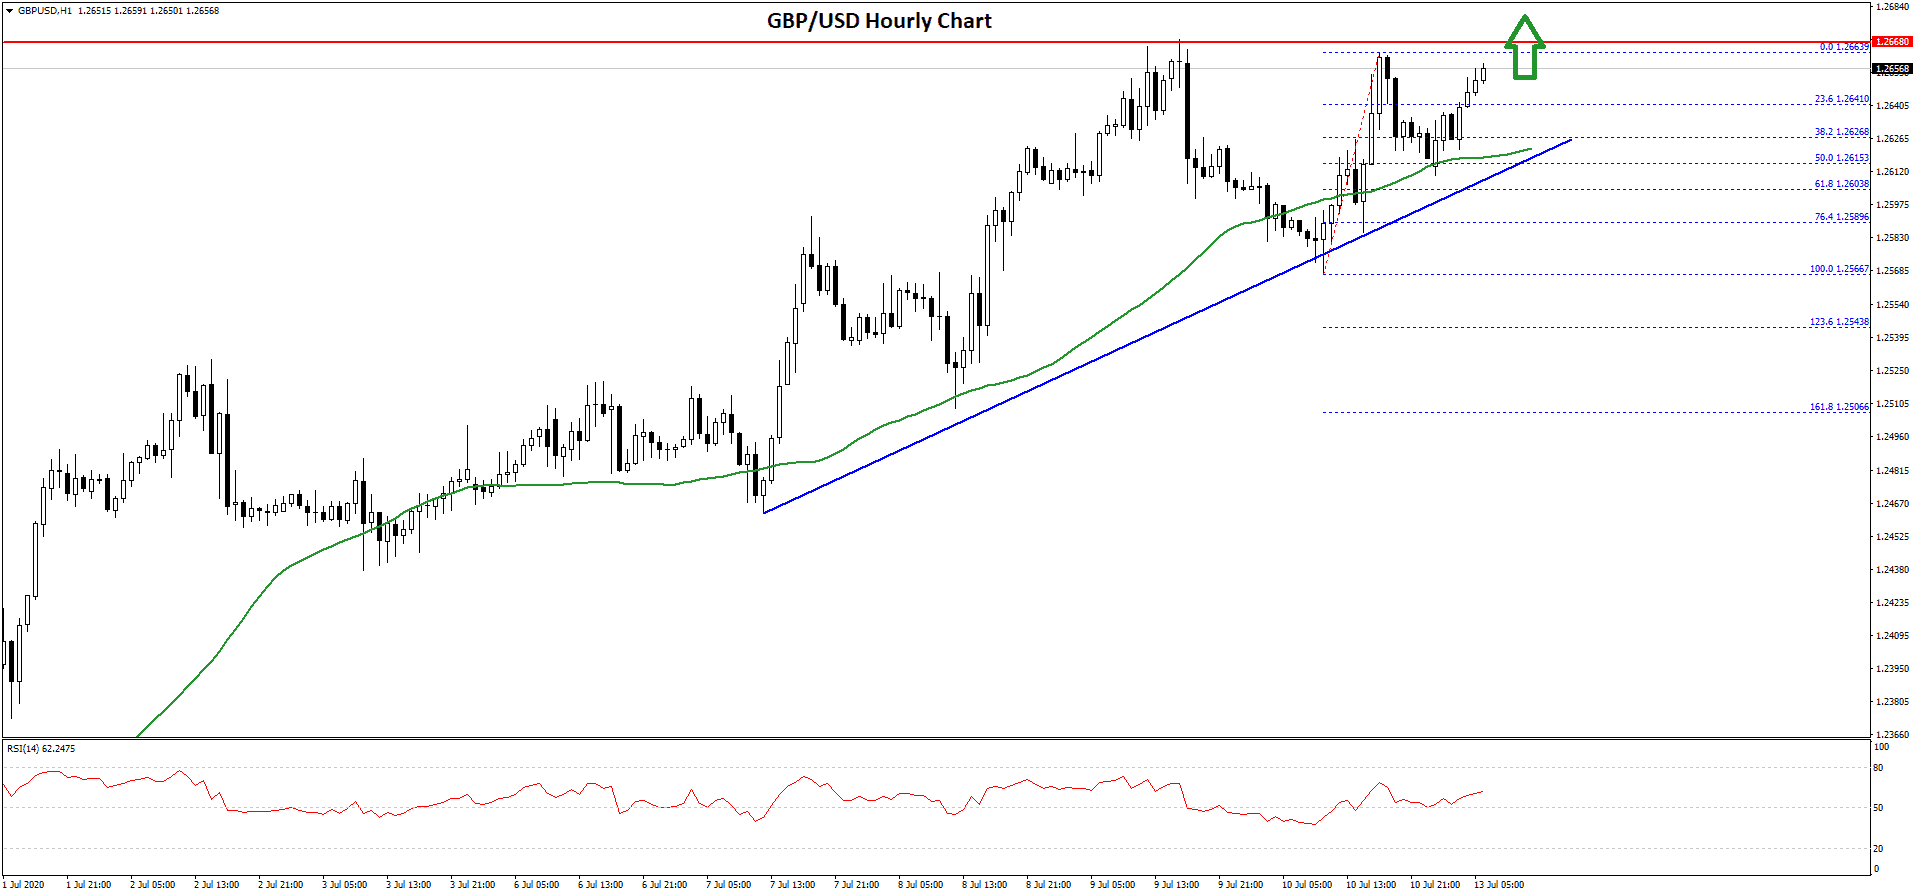
There was a downside correction below the 1.2640 and 1.2620 levels. The pair even spiked below 1.2600 and the 50 hourly simple moving average. It found support near the 1.2566 level and it is currently rising.
On the downside, there is a decent support forming near the 1.2625 level, and the 38.2% Fib retracement level of the recent wave from the 1.2566 low to 1.2663 high.
It seems like there is a key bullish trend line forming with support near 1.2625 on the hourly chart of GBP/USD. The trend line is close to the 50% Fib retracement level of the recent wave from the 1.2566 low to 1.2663 high.
If there is a downside break below the trend line support and 1.2620, the pair could start a fresh decline towards the 1.2580 and 1.2560 levels. Conversely, it is likely to surpass the 1.2660 and 1.2680 resistance levels. The next major resistance on the upside is near the 1.2720 level.
EUR/GBP Technical Analysis
The Euro failed to gain momentum above the 0.9050 level and started a fresh decline against the British Pound. The EUR/GBP pair broke the key 0.9000 support area to move into a bearish zone.
The pair even broke the 0.8980 level and settled below the 50 hourly simple moving average. It traded as low as 0.8937 and it is currently consolidating losses. An initial resistance on the upside is seen near the 0.8955 level.
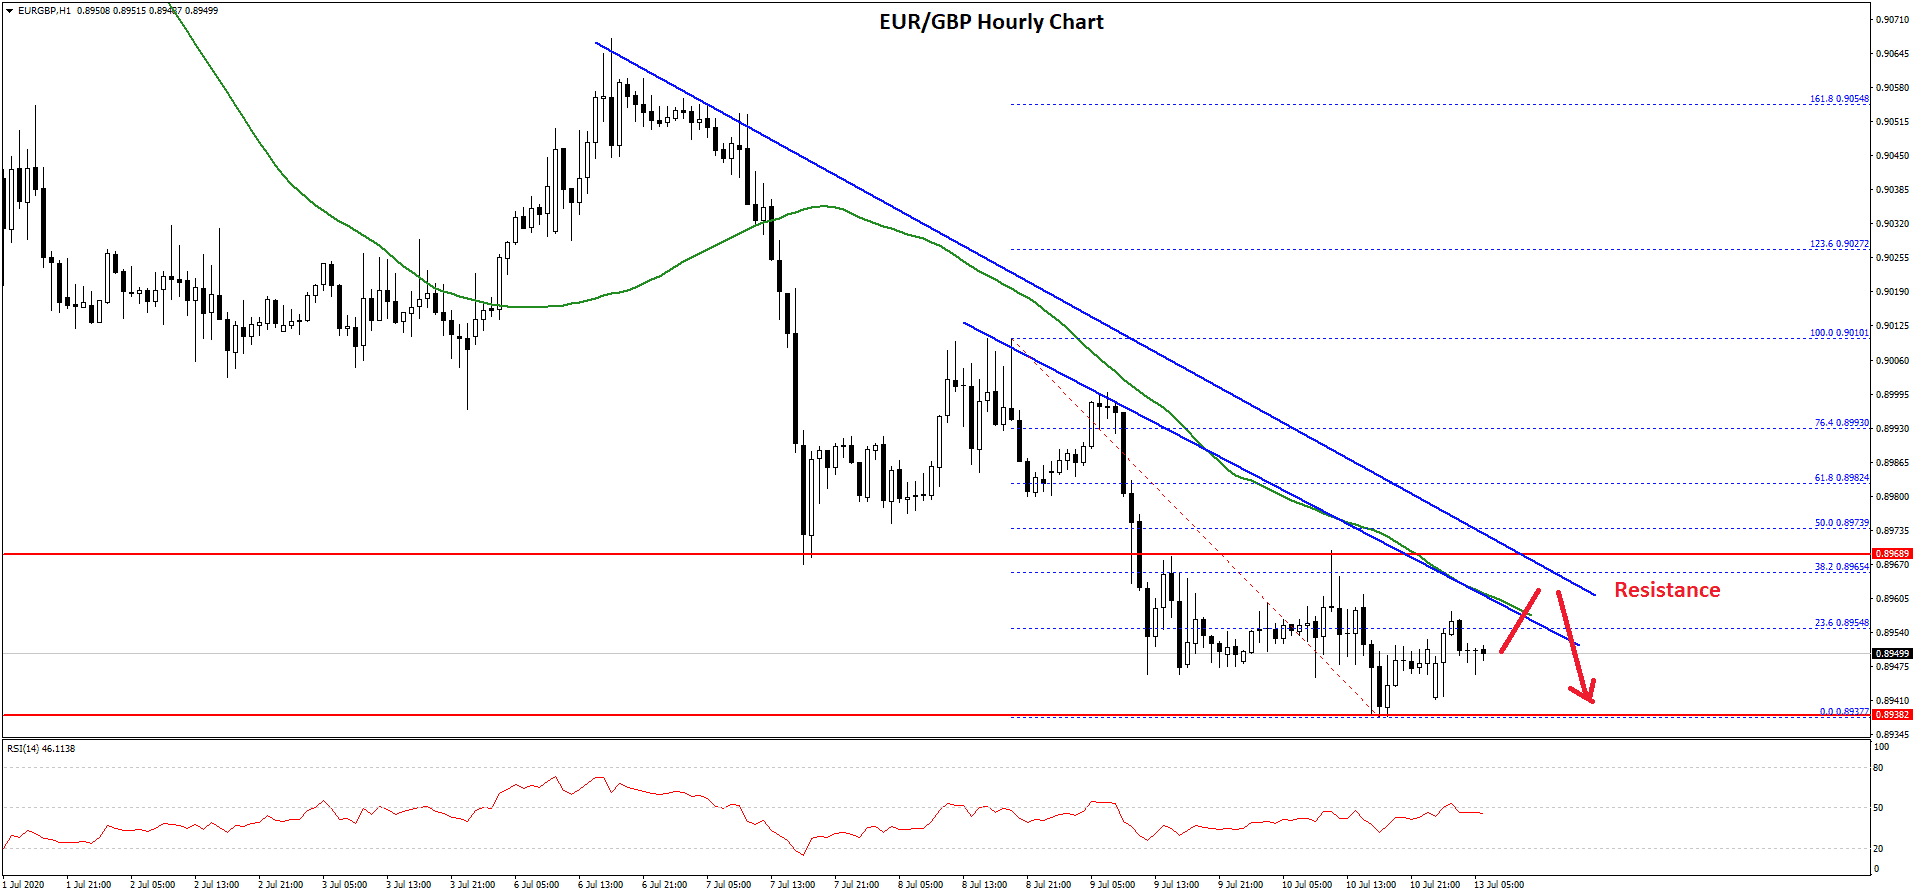
The 23.6% Fib retracement level of the recent decline from the 0.9010 high to 0.8937 low is also near 0.8955. More importantly, there are two bearish trend lines forming with resistance near 0.8965 on the hourly chart.
The 50 hourly simple moving average is also near the trend line resistance at 0.8960. Above the trend lines, the next resistance could be 0.8975 or the 50% Fib retracement level of the recent decline from the 0.9010 high to 0.8937 low.
To move into a positive zone, the pair must gain pace above the 0.8965 and 0.8975 resistance levels. The main resistance is now near 0.9000, above which EUR/GBP might move into a positive zone.
Conversely, the pair could continue to decline below the 0.8940 and 0.8930 levels. The next major support is near the 0.8900 level, where the bulls might take a stand.
Trade over 50 forex markets 24 hours a day with FXOpen. Take advantage of low commissions, deep liquidity, and spreads from 0.0 pips. Open your FXOpen account now or learn more about trading forex with FXOpen.
This article represents the opinion of the Companies operating under the FXOpen brand only. It is not to be construed as an offer, solicitation, or recommendation with respect to products and services provided by the Companies operating under the FXOpen brand, nor is it to be considered financial advice.
Latest from Forex Analysis
Latest articles

Anchored VWAP and How You Can Use It in Forex Trading
In the world of forex trading, understanding the nuanced tools at your disposal can significantly enhance decision-making processes. One such sophisticated tool is the Anchored Volume-Weighted Average Price (Anchored VWAP), which refines the standard VWAP by allowing traders to set

META Share Price Collapses after Publication of Quarterly Report
Just yesterday, META's stock price closed at USD 493.50, up approximately 40% since the start of 2024 and up nearly 300% since the start of 2023.
However, following the release of Meta's quarterly report, its shares plummeted to USD

USD/JPY Analysis: The Rate Exceeds The Level of 155 Yen Per US Dollar
Today, the price of USD/JPY once again renewed its 34-year high, exceeding the level of 155 yen per dollar, which put pressure on the current authorities.
According to Reuters, officials are trying to maintain calm in the market.
"We