


FXOpen
GBP/USD traded higher recently and tested the 1.2700 resistance. EUR/GBP remains in an uptrend above the key 0.9000 support area.
Important Takeaways for GBP/USD and EUR/GBP
- The British Pound recently tested the 1.2700 resistance and later corrected lower.
- There is a major breakout pattern formed with resistance at 1.2700 on the hourly chart of GBP/USD.
- EUR/GBP is following a nice uptrend above the 0.9000 support and a bullish trend line on the hourly chart.
- The pair needs to break the 0.9025 resistance to trade further higher in the near term.
GBP/USD Technical Analysis
The British Pound formed a decent support base near the 1.2600-1.2620 area against the US Dollar. The GBP/USD pair traded above the 1.2650 resistance area to move into a positive zone.
The pair tested the 1.2700 resistance and formed a high at 1.2707 on FXOpen. Later, the pair started consolidating gains below the 1.2700 level and declined below the 23.6% Fib retracement level of the last wave from the 1.2619 low to 1.2707 high.
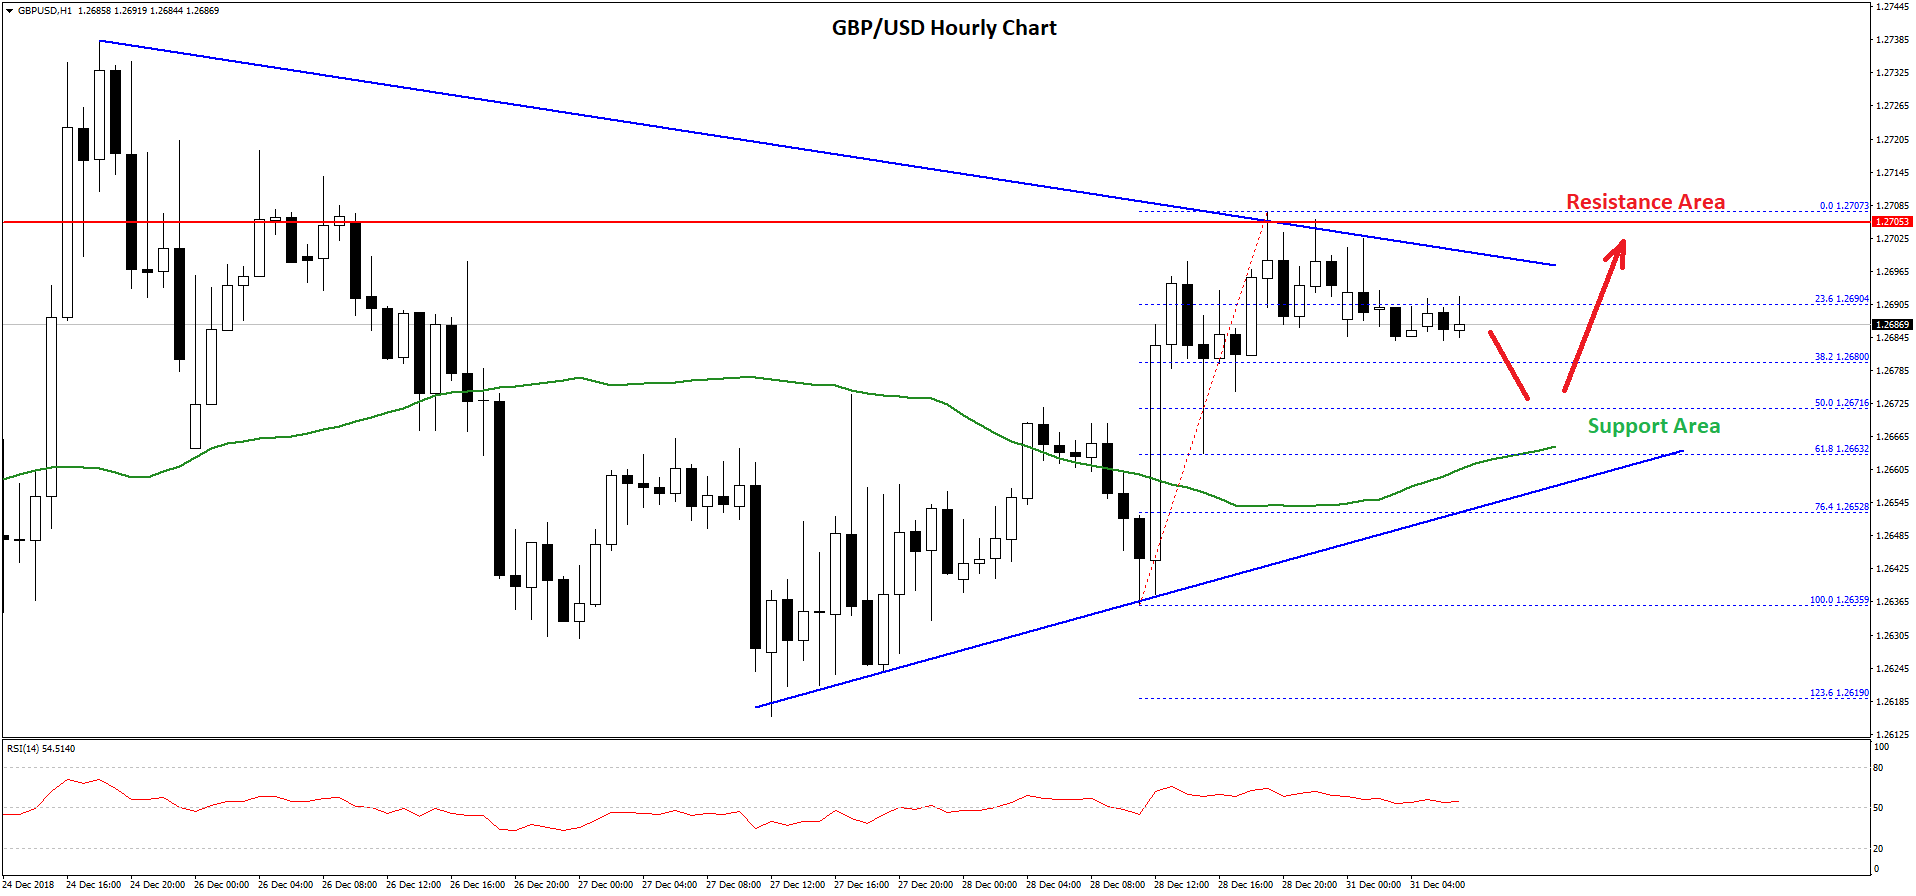
However, there are many supports on the downside near the 1.2670 level and the 50 hourly simple moving average. Besides, the 50% Fib retracement level of the last wave from the 1.2619 low to 1.2707 high is also near 1.2670.
More importantly, there is a major breakout pattern formed with resistance at 1.2700 on the hourly chart of GBP/USD. The pair may dip a few pips in the near term, but it is likely to find support near the 1.2670 or 1.2665 level.
On the upside, a break above the 1.2700 resistance area is needed for more gains. The next key resistance is near the 1.2740 and 1.2750 levels.
Overall, GBP/USD seems to be preparing for the next break either above 1.2700 or below 1.2650. As long as it is above the 1.2650 level, it is likely to clear the 1.2700 barrier in the near term.
EUR/GBP Technical Analysis
The Euro gained bullish momentum recently and cleared the 0.9000 and 0.9030 resistance levels against the British Pound. The EUR/GBP pair even broke the 0.9050 resistance area and traded towards the 0.9065 resistance.
A high was formed at 0.9059 and later the pair corrected lower below 0.9030 and the 50 hourly simple moving average. There was a break below the 50% Fib retracement level of the last wave from the 0.8974 low to 0.9059 high.
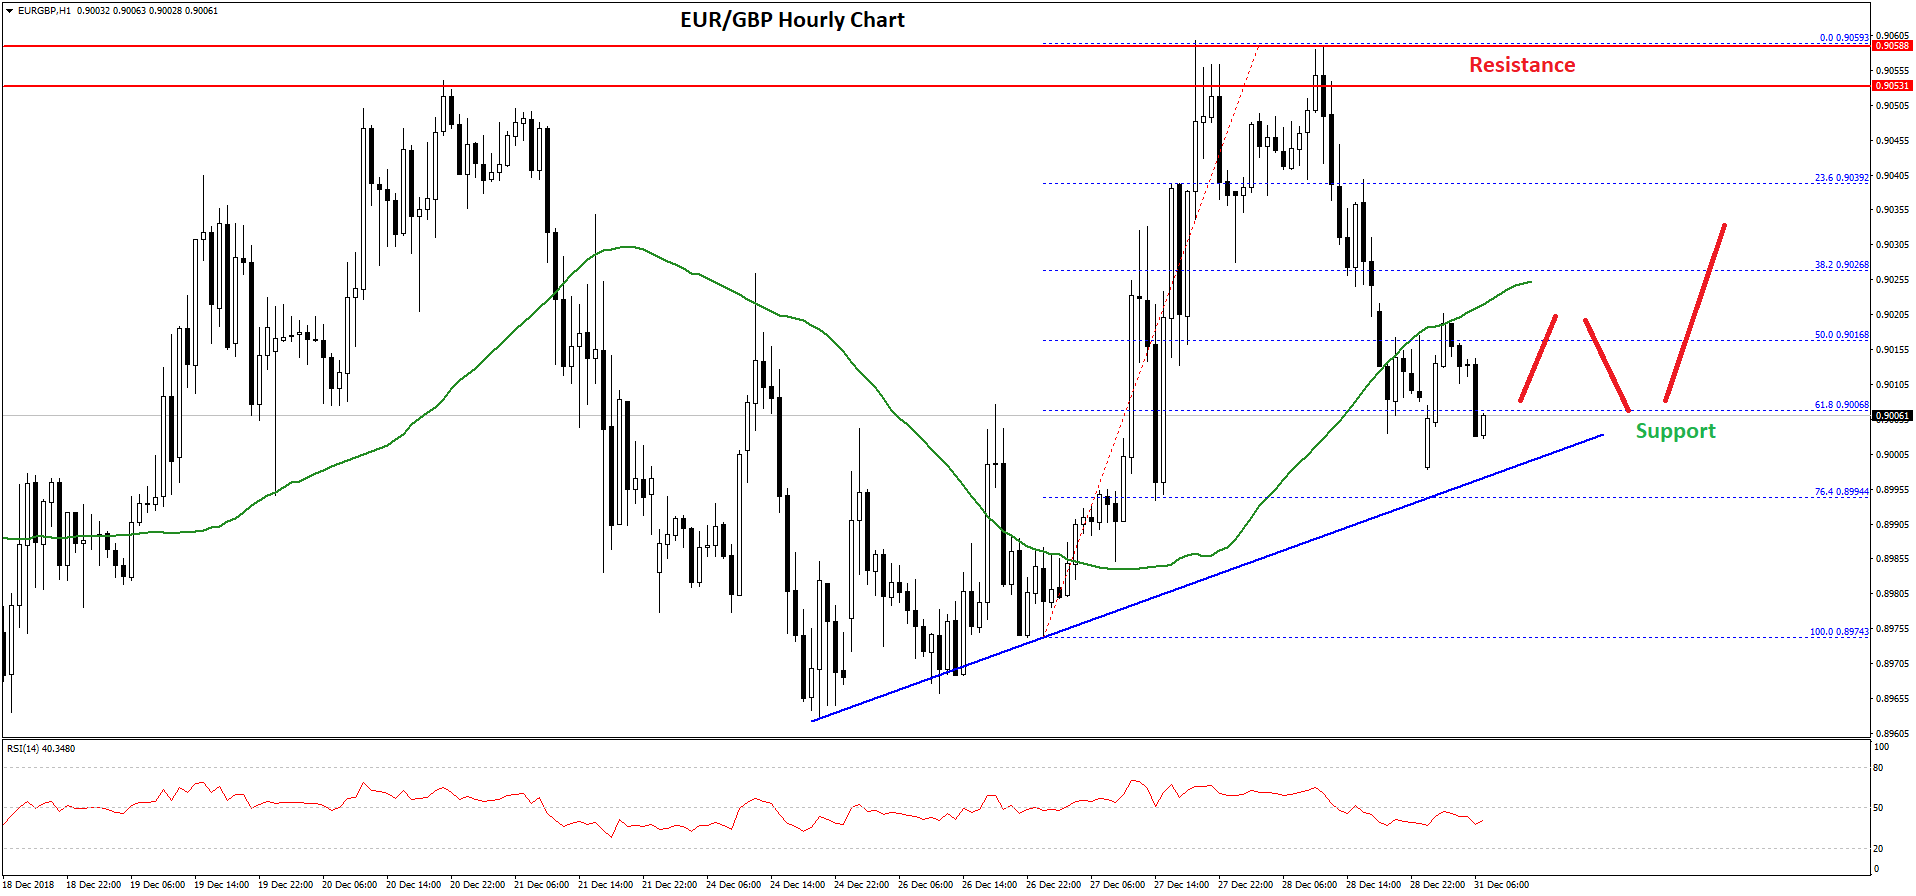
However, the pair tested the key 0.9000 support where buyers emerged. Besides, there is a solid bullish trend line formed with support at 0.9000 on the hourly chart.
Finally, the 61.8% Fib retracement level of the last wave from the 0.8974 low to 0.9059 high is also acting as a support. As long as the pair is above 0.9000, it is likely to bounce back above 0.9020 and 0.9030.
Above 0.9030, the pair may continue towards the 0.9050 and 0.9060 resistance levels. On the other hand, if there is a downside break below the 0.9000 support, EUR/GBP may decline sharply towards the 0.8975 support. The main support for buyers below 0.8975 is near the 0.8960, which is a crucial pivot zone.
Trade over 50 forex markets 24 hours a day with FXOpen. Take advantage of low commissions, deep liquidity, and spreads from 0.0 pips. Open your FXOpen account now or learn more about trading forex with FXOpen.
This article represents the opinion of the Companies operating under the FXOpen brand only. It is not to be construed as an offer, solicitation, or recommendation with respect to products and services provided by the Companies operating under the FXOpen brand, nor is it to be considered financial advice.
Latest from Forex Analysis
Latest articles

Google Share Price Rose Post-market to a New All-time Record
Yesterday, after the close of the main trading session, a report on activities for the 1st quarter of Alphabet Inc. (Google's parent company) was published. The report was strong, exceeding investors' expectations.
→ Quarterly EPS = USD 1.89 (expected = USD 1.

S&P 500 Rebounds after Negative GDP News
Data released yesterday showed US GDP growth slowed to 1.6% in the first quarter of the year. According to ForexFactory: forecast = 2.2%, past value = 2.4%.
Reaction to the news sent the S&P 500 mini stock

GBP/USD And USD/CAD Daily Chart Outlook
GBP/USD is attempting a recovery wave from 1.2300. USD/CAD is consolidating and might aim for a move above the 1.3760 resistance zone.
Important Takeaways for GBP/USD and USD/CAD Analysis Today
· The British Pound started