


FXOpen
GBP/USD declined heavily recently before buyers appeared near the 1.2850 support. EUR/GBP is struggling to break the 0.8760-0.8770 resistance and it could decline further.
Important Takeaways for GBP/USD and EUR/GBP
- The British Pound traded as low as 1.2853 and later started an upside correction.
- There is a major bearish trend line in place with resistance at 1.2945 on the hourly chart of GBP/USD.
- EUR/GBP is under a lot of pressure below the 0.8760 and 0.8770 resistance levels.
- There is a connecting bearish trend line formed with resistance at 0.8770 on the hourly chart.
GBP/USD Technical Analysis
The British Pound started a significant downward move from the 1.3150 resistance area against the US Dollar. The GBP/USD pair declined heavily and broke the 1.3080 and 1.3000 support levels.
The decline was such that the pair even broke the 1.2900 support level. It traded as low as 1.2853 on FXOpen and later started an upside correction. Buyers were successful in pushing the pair above the 1.2900 and 1.2920 resistance levels.
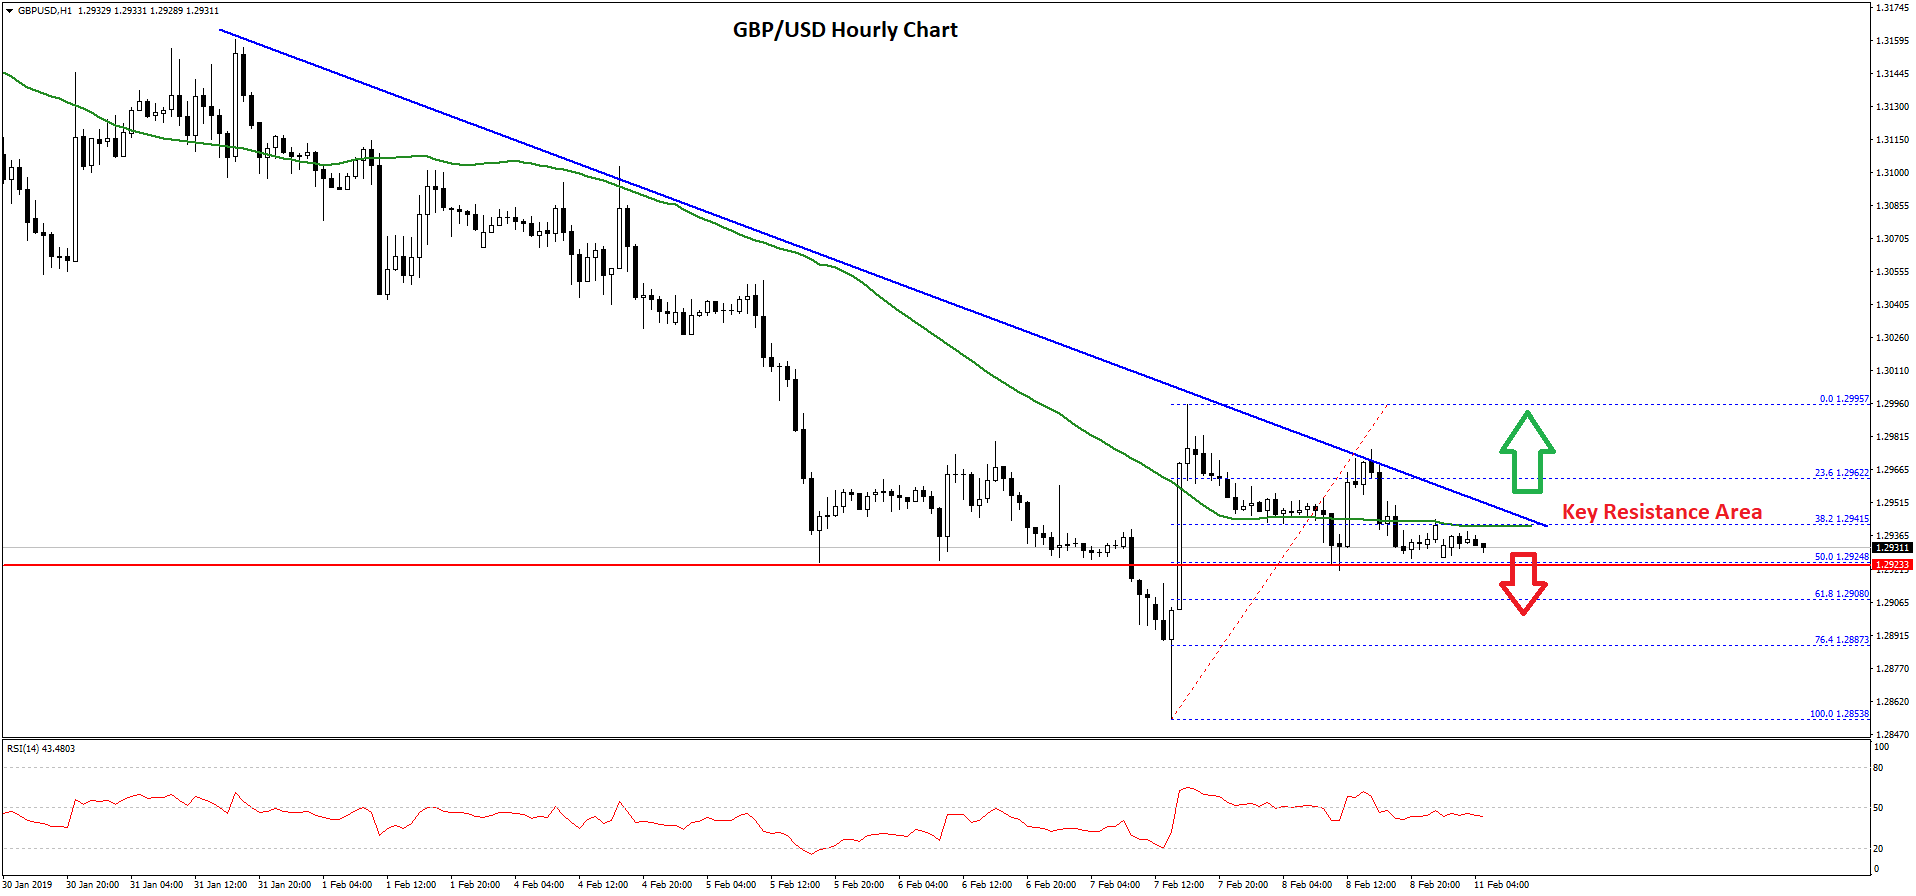
The pair traded close to the 1.3000 resistance, but it failed to hold gains. There was a fresh drop below the 1.2950 level and the 50 hourly simple moving average. On the downside, the 1.2920 and 1.2925 levels are acting as decent supports.
If there is a break below the 1.2920 support, there could be a nasty drop in GBP/USD below the 1.2900 level in the near term. The next key support is near the 1.2850 level, followed by 1.2820.
On the upside, there is a strong resistance formed near the 1.2940 level and the 50 hourly simple moving average. There is also a major bearish trend line in place with resistance at 1.2945 on the hourly chart of GBP/USD.
Therefore, a proper close above the 1.2940 and 1.2950 resistances is must for a fresh recovery towards the 1.3000 or 1.3050 level. If not, there is a risk of more declines below 1.2920 and 1.2900.
EUR/GBP Technical Analysis
The Euro followed a positive structure from the 0.8720 support level against the British Pound. However, the EUR/GBP pair faced a strong resistance near 0.8820 and later declined sharply below 0.8780.
The pair gained bearish momentum and declined below the 0.8760 and 0.8740 supports. It settled below the 0.8760 level and the 50 hourly simple moving average. A low was formed at 0.8728 and later the pair corrected higher.
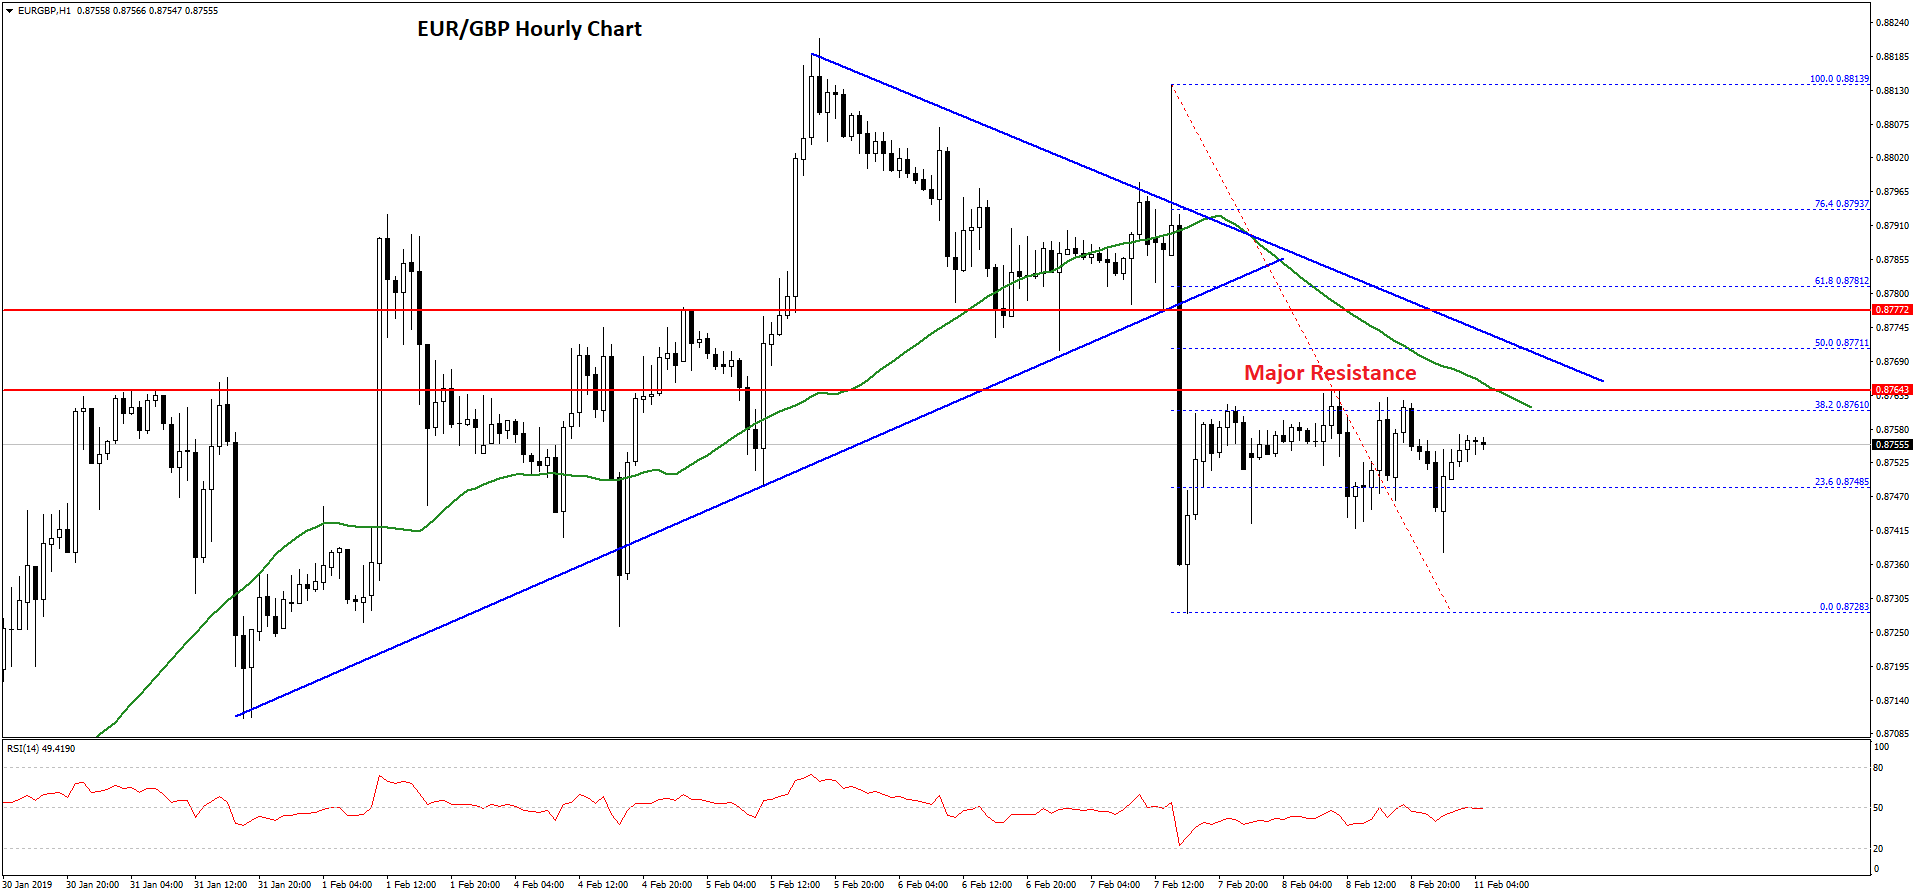
It climbed above the 23.6% Fib retracement level of the recent decline from the 0.8813 high to 0.8728 low. However, the upside move was protected by the 0.8760 and 0.8770 resistance levels.
Moreover, there is a connecting bearish trend line formed with resistance at 0.8770 on the hourly chart. The 50 hourly simple moving average and the 50% Fib retracement level of the recent decline from the 0.8813 high to 0.8728 low are also near the trend line.
Therefore, a proper break above the 0.8770 resistance and bearish trend line is must for a decent upward move in the near term. The next key resistance is at 0.8800, followed by 0.8820.
If EUR/GBP fails to move above the 0.8770 resistance, there is a risk of a downside reaction below the 0.8750 and 0.8740 support levels. The next key supports are at 0.8725 and 0.8710.
Trade over 50 forex markets 24 hours a day with FXOpen. Take advantage of low commissions, deep liquidity, and spreads from 0.0 pips. Open your FXOpen account now or learn more about trading forex with FXOpen.
This article represents the opinion of the Companies operating under the FXOpen brand only. It is not to be construed as an offer, solicitation, or recommendation with respect to products and services provided by the Companies operating under the FXOpen brand, nor is it to be considered financial advice.
Latest from Forex Analysis
Latest articles

Since the Start of the Week, Brent Oil Price Has Dropped over 4%
At the beginning of the week, March 15, we wrote that the price of Brent oil could form a correction from the resistance level of USD 91 per barrel. Since then, the price has decreased by more than 4% due

Fair Value Gaps vs Liquidity Voids in Trading
Understanding fair value gaps and liquidity voids is essential for traders seeking to navigate the complexities of the financial markets. These concepts, deeply rooted in the Smart Money Concept (SMC), provide valuable insights into the dynamics of supply and demand,

UK100 Share Index Rises as UK Inflation Slows
Yesterday, the UK Office for National Statistics (ONS) reported that the CPI stood at 3.2% in March. According to ForexFactory, analysts expected 3.1%, and a month ago the index was 3.4%.
Grant Fitzner, chief economist at the