


FXOpen

GBP/USD rallied recently and broke the 1.2650 resistance zone. GBP/JPY is also rising and it is trading well above the 138.00 pivot and support zone.
Important Takeaways for GBP/USD and GBP/JPY
- The British Pound started a strong rise and broke many hurdles near 1.2600.
- There is a key bullish trend line forming with support near 1.2700 on the hourly chart of GBP/USD.
- GBP/JPY is following a bullish path and it recently climbed above the 139.00 levels.
- There is a crucial bullish trend line forming with support near 138.30 on the hourly chart.
GBP/USD Technical Analysis
This past week, the British Pound started a major upward move above the 1.2500 barrier against the US Dollar. The GBP/USD pair broke many hurdles near 1.2600 to move into a bullish zone.
There was also a close above the 1.2700 level and the 50 hourly simple moving average. The pair traded to a new monthly high at 1.2732 on FXOpen and it is currently consolidating gains.
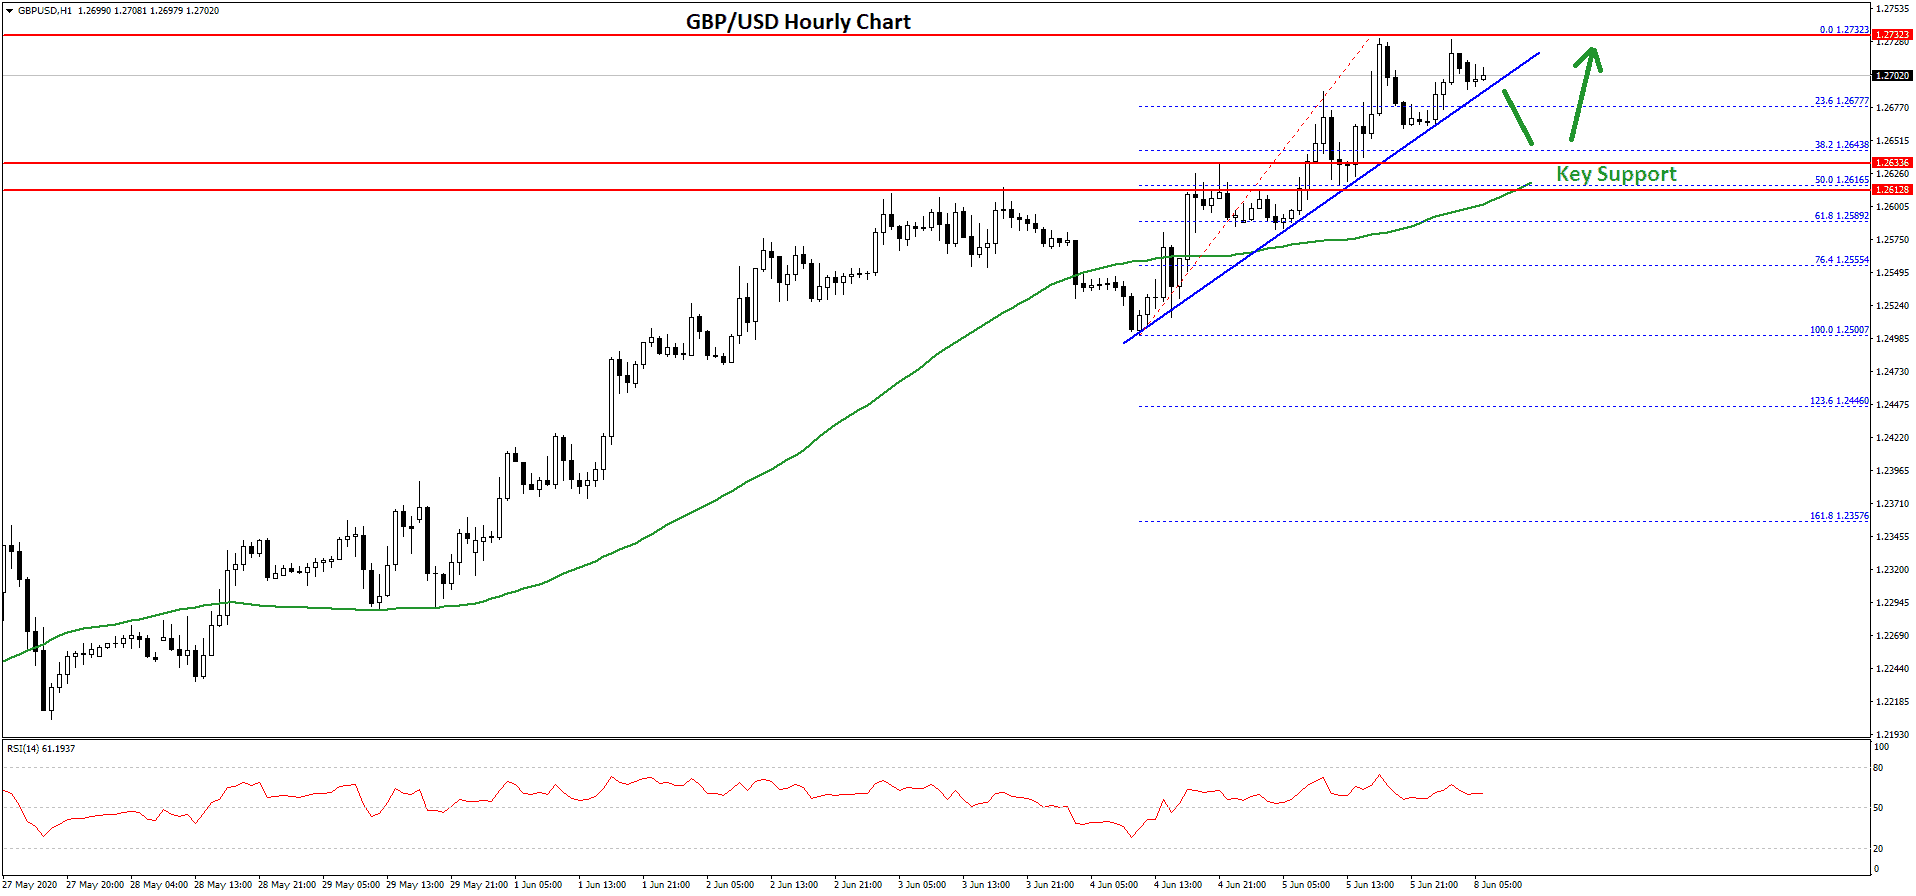
It tested the 23.6% Fib retracement level of the upward move from the 1.2500 low to 1.2732 high. An immediate support on the downside is near the 1.2700 level. There is also a key bullish trend line forming with support near 1.2700 on the hourly chart of GBP/USD.
If the pair breaks the trend line support, it could decline towards the main 1.2620 support zone and the 50 hourly simple moving average. The 50% Fib retracement level of the upward move from the 1.2500 low to 1.2732 high is also near the 1.2620 support.
Any further losses may perhaps start a major decline towards the 1.2550 and 1.2500 support levels. Conversely, the pair might continue to move up above the 1.2720 and 1.2740 resistance levels.
The next major resistance is near the 1.2780 level, above which GBP/USD could accelerate towards the 1.2850 level in the near term.
GBP/JPY Technical Analysis
The British Pound is also following a similar pattern and it is following a bullish path above the 138.00 zone against the Japanese Yen. The GBP/JPY pair gained traction in the past few days and it even broke the 139.00 level.
A high is formed near the 139.73 level and the pair is currently consolidating in a range. An initial support is near the 138.85 level. It is close to the 23.6% Fib retracement level of the upward move from the 135.95 low to 139.73 high.
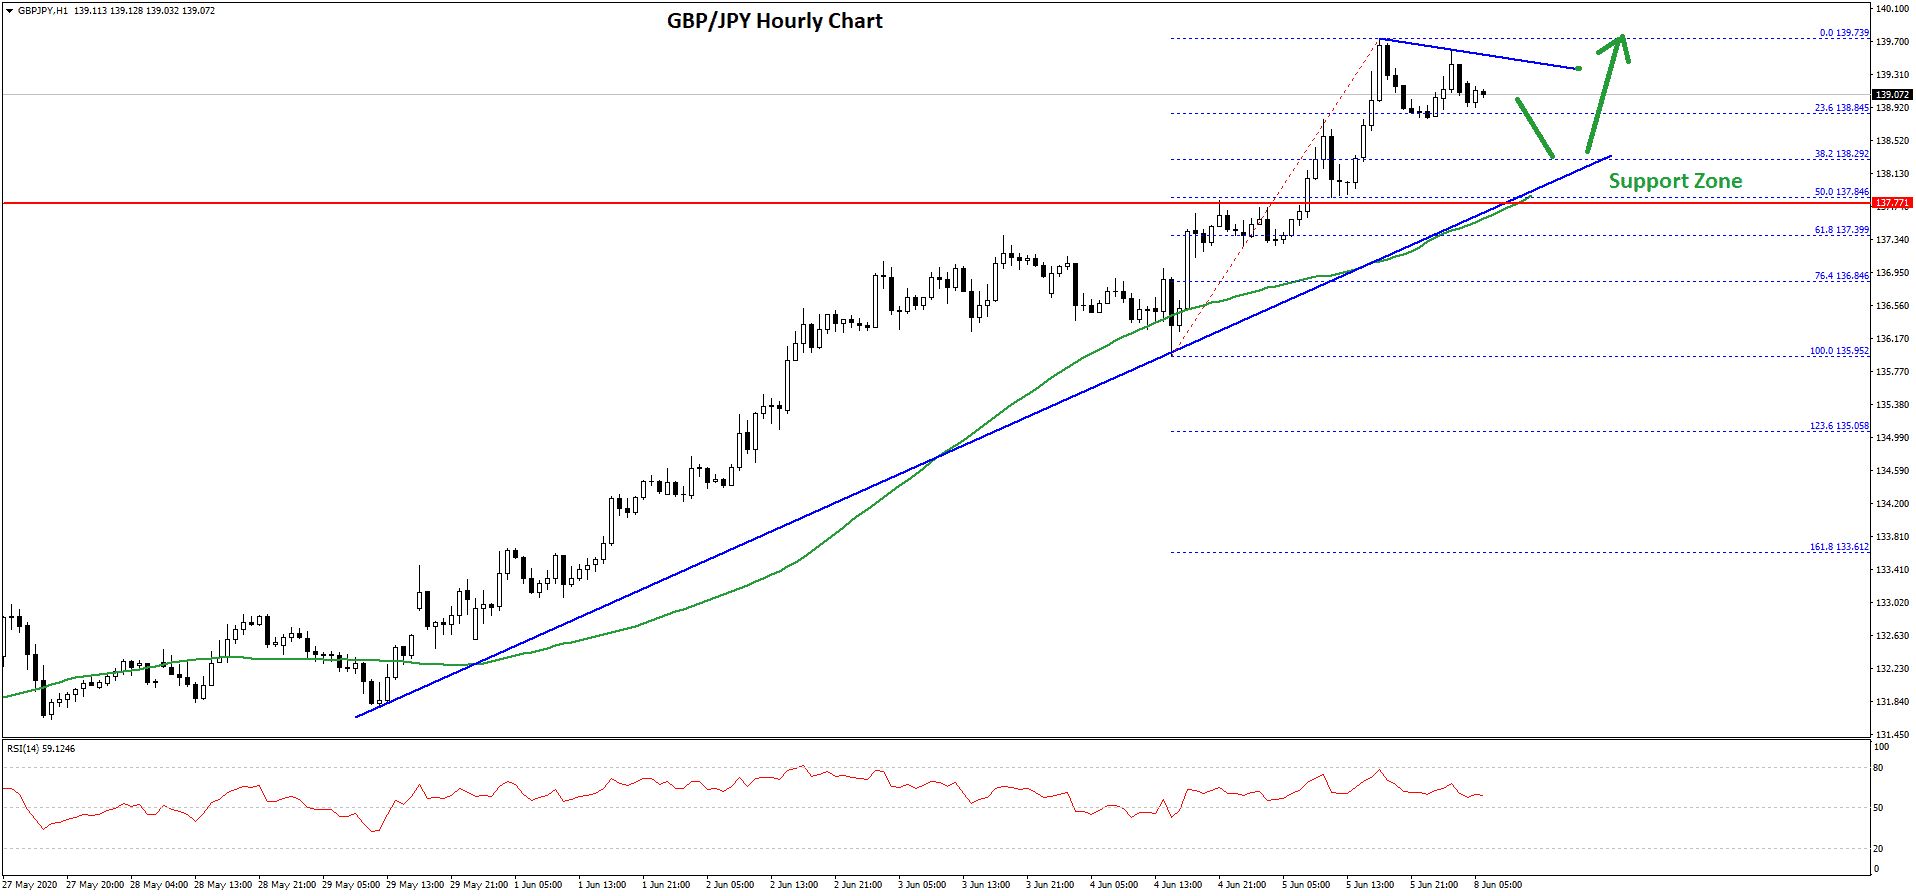
Moreover, there is a crucial bullish trend line forming with support near 138.30 on the hourly chart. The next key support is near the 137.80 level and the 50 hourly simple moving average.
The 50% Fib retracement level of the upward move from the 135.95 low to 139.73 high is also near the 137.85 level to act as a strong support. Any further losses may perhaps call for a sharp decline towards the 136.50 support level or the 136.00 handle.
On the upside, there is a hurdle forming near the 139.70 level and a connecting bearish trend line. If there is a close above the 139.70 and 140.00 levels, there are chances of more gains.
The next major resistance on the upside is seen near the 141.50 level, followed by the main 142.00 region.
Trade over 50 forex markets 24 hours a day with FXOpen. Take advantage of low commissions, deep liquidity, and spreads from 0.0 pips. Open your FXOpen account now or learn more about trading forex with FXOpen.
This article represents the opinion of the Companies operating under the FXOpen brand only. It is not to be construed as an offer, solicitation, or recommendation with respect to products and services provided by the Companies operating under the FXOpen brand, nor is it to be considered financial advice.
Latest from Forex Analysis
Latest articles

Weekly Market Wrap With Gary Thomson: UK100, USD, GOLD, OIL
Get the latest scoop on the week's hottest headlines, all in one convenient video. Join Gary Thomson, the COO of FXOpen UK, as he breaks down the most significant news reports and shares his expert insights.
- UK100 Share Index Rises

What Is a Darvas Box Theory and How Does It Work in Trading?
The Darvas Box Theory, pioneered by Nicolas Darvas in the 1950s, has transcended its stock market origins to become a valuable tool for forex traders. This method leverages specific price movements and patterns, known as the Darvas Box, to track

NFLX Stock Price Falls Despite Subscriber Growth
Yesterday, after the close of the main trading session on the stock market, Netflix reported to investors for the 1st quarter of 2024.
The report turned out better than expected:
→ earnings per share: actual = USD 5.28, forecast = USD 4.