


FXOpen

GBP/USD failed twice near the 1.3250 resistance area and declined sharply. GBP/JPY is also trading in a negative zone and it could continue to move down if it breaks the 138.35 support.
Important Takeaways for GBP/USD and GBP/JPY
- The British Pound started a major decline after it failed to clear 1.3250 and 1.3260.
- There is a short-term breakout pattern forming with resistance near 1.3100 on the hourly chart of GBP/USD.
- GBP/JPY also declined sharply after it failed to surpass the 140.00 resistance zone.
- There is a key declining channel forming with resistance near 138.58 on the hourly chart.
GBP/USD Technical Analysis
This past week, the British Pound made another attempt to gain pace above the 1.3250 resistance against the US Dollar. However, the GBP/USD pair failed to continue higher and started a sharp decline.
A high was formed near 1.3254 on FXOpen and the pair dived below the 1.3150 support. There was also a break below the 1.3120 support zone and the 50 hourly simple moving average. The pair traded close to the 1.3050 support and a low is formed near 1.3059.
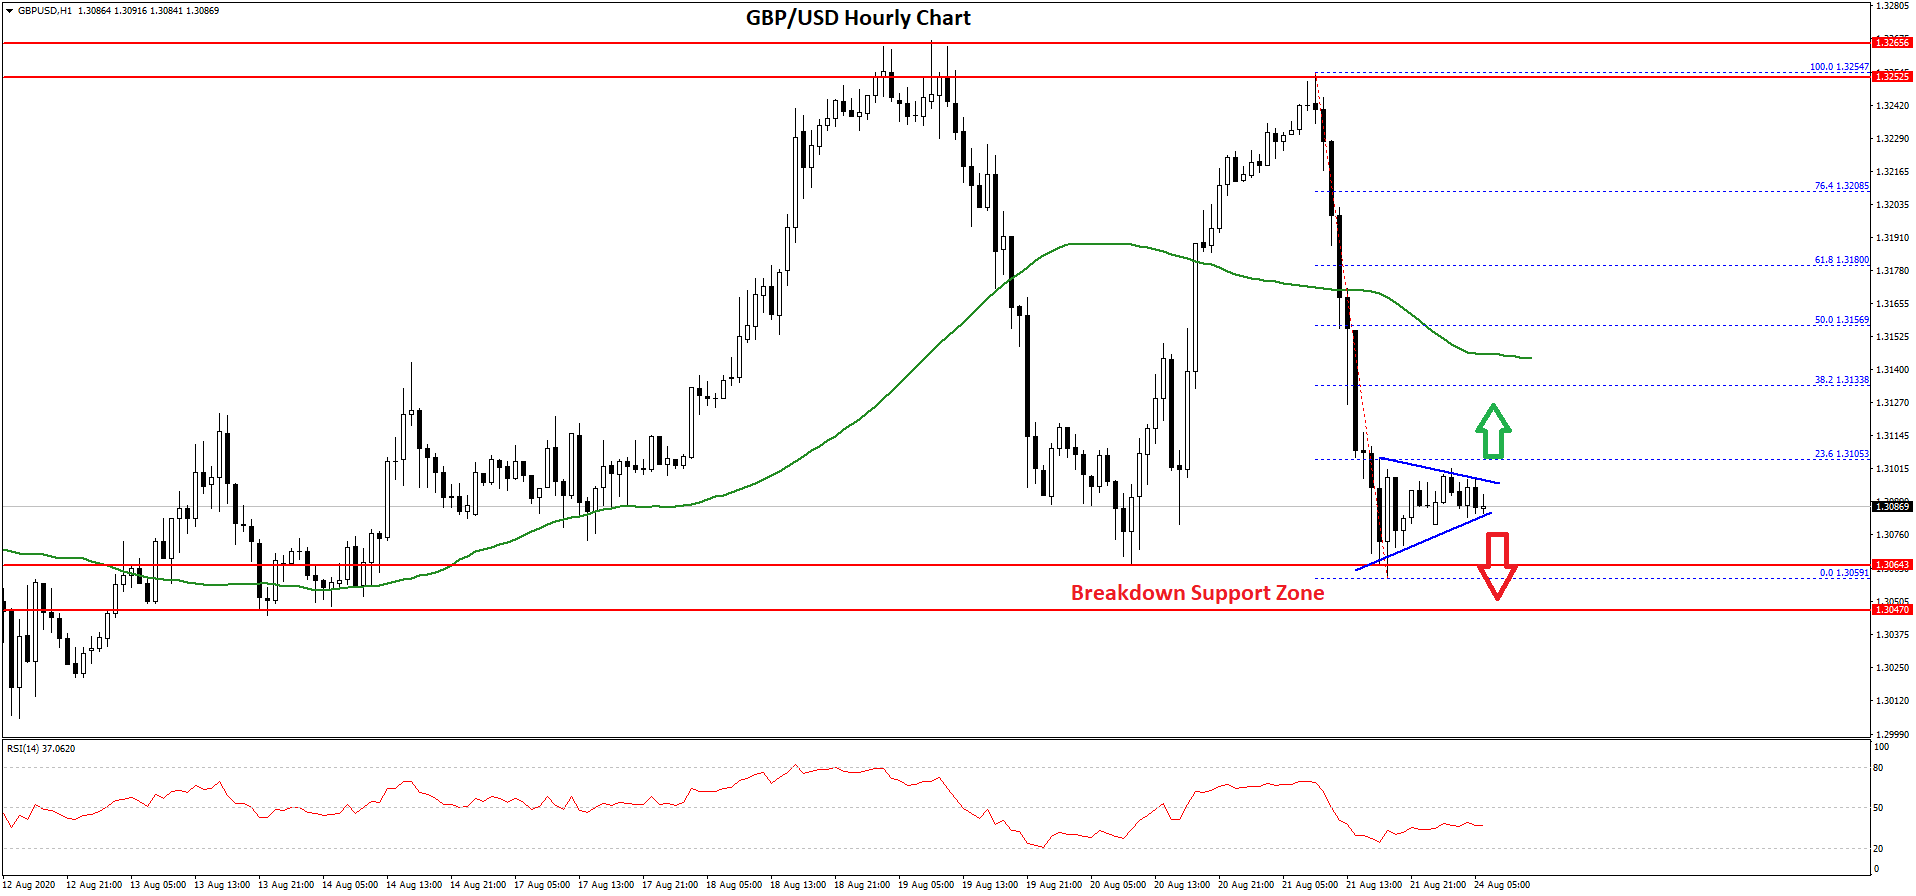
It is currently consolidating losses and trading above 1.3080. It seems like there is a short-term breakout pattern forming with resistance near 1.3100 on the hourly chart of GBP/USD.
Above the triangle resistance, the first resistance is near the 1.3150 level. It is close to the 23.6% Fib retracement level of the recent decline from the 1.3254 high to 1.3059 low. On the upside, the next key resistance might be 1.3150 or the 50 hourly simple moving average.
The main resistance is near the 1.3160 level since it is close to the 50% Fib retracement level of the recent decline from the 1.3254 high to 1.3059 low. Any further gains could lead the pair towards the 1.3250 barrier in the near term.
Conversely, the pair could continue to decline below the 1.3060 and 1.3050 support levels. The next major support for the bulls might be 1.3000.
GBP/JPY Technical Analysis
The British Pound also followed a similar path from the 140.00 resistance against the Japanese Yen. The GBP/JPY pair broke the 139.20 support to move into a short-term bearish zone.
There was also a break below the 138.80 support and the pair settled below the 50 hourly simple moving average. A low is formed near 138.24 and the pair is currently correcting higher. It seems to be facing hurdles near the 138.60 zone.
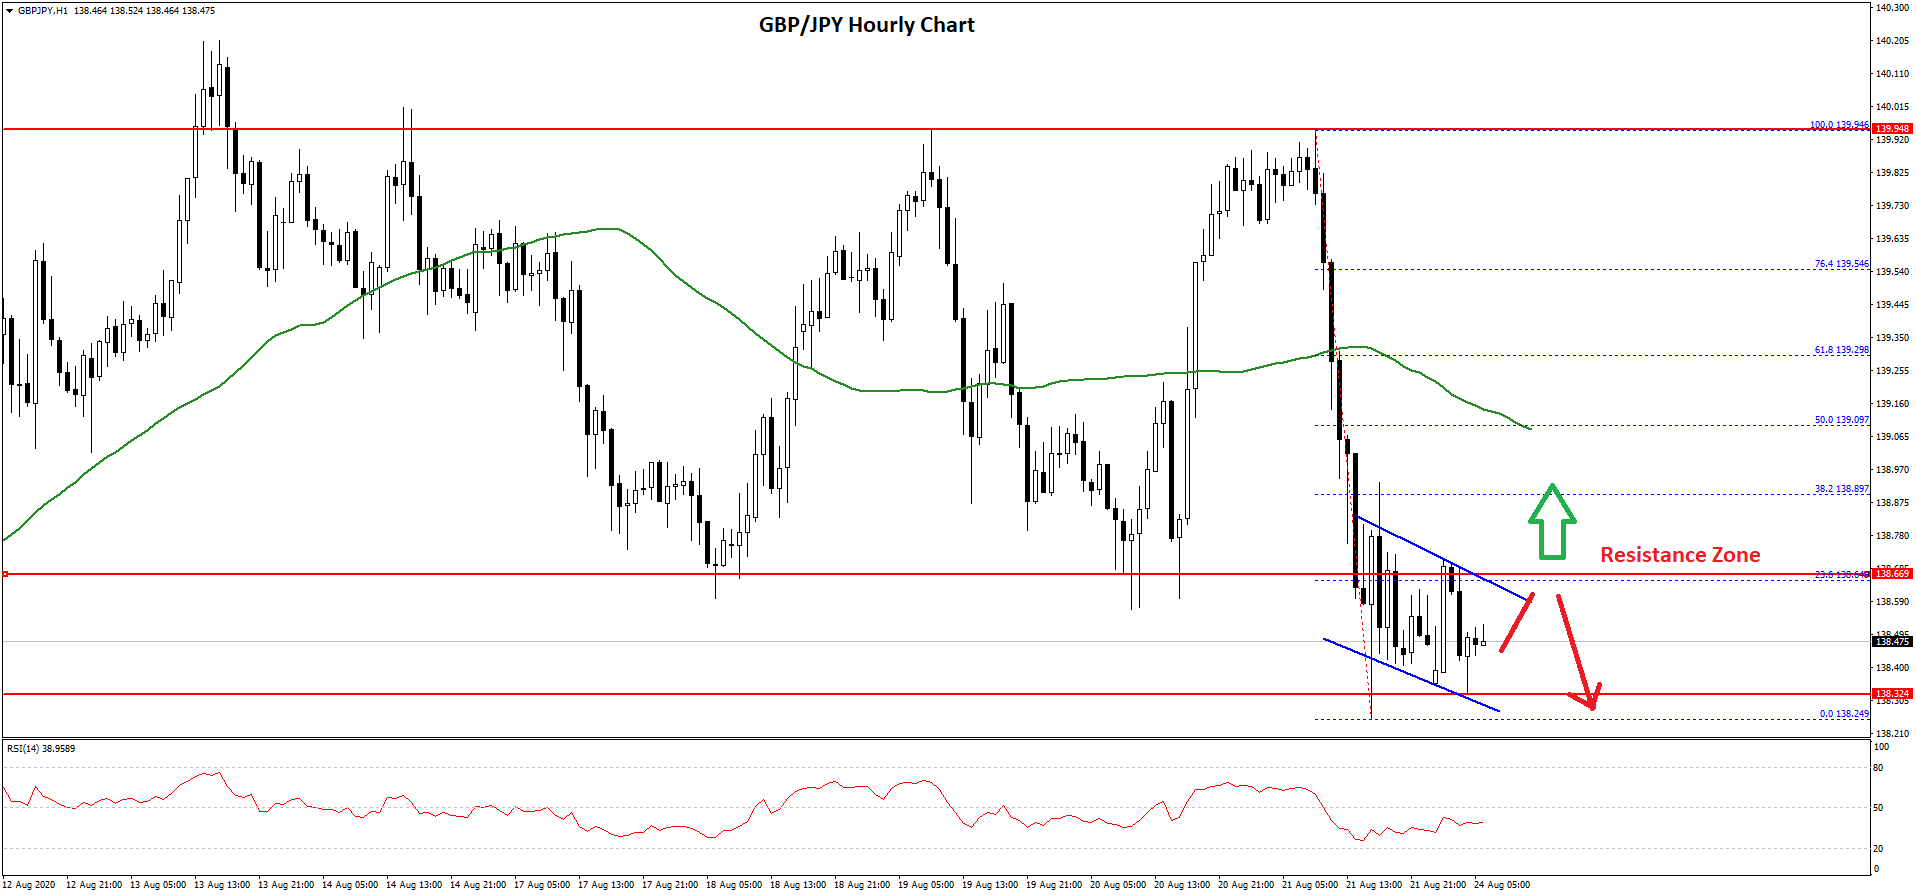
There is also a key declining channel forming with resistance near 138.58 on the hourly chart. The channel resistance is close to the 23.6% Fib retracement level of the recent decline from the 139.94 high to 138.24 low.
If there is an upside break above the 138.60 resistance, there are chances of a steady rise in the coming sessions. The next key resistance for the bulls might be near the 139.00 zone.
The 50% Fib retracement level of the recent decline from the 139.94 high to 138.24 low is also near the 139.10 level to act as a hurdle. Conversely, the pair could break the 138.30 support level and continue to move down.
The next major support on the downside is near the 138.00 level, below which there are high chances of a sustained downward move.
Trade over 50 forex markets 24 hours a day with FXOpen. Take advantage of low commissions, deep liquidity, and spreads from 0.0 pips. Open your FXOpen account now or learn more about trading forex with FXOpen.
This article represents the opinion of the Companies operating under the FXOpen brand only. It is not to be construed as an offer, solicitation, or recommendation with respect to products and services provided by the Companies operating under the FXOpen brand, nor is it to be considered financial advice.
Latest from Forex Analysis
Latest articles

The Price of Gold XAU/USD Shows Strongest Fall in Almost 2 Years
On Monday, the price of gold fell from USD 2,386 to USD 2,333 per ounce — this is the strongest drop in one day in almost 2 years, according to Bloomberg. On Tuesday morning in the Asian session, the

Hong Kong-listed Chinese Insurer Goes on Rally as Western Giants Retract
The Asia Pacific region has once again become an area of great interest to investors and traders as some remarkable patterns of volatility have begun to make their presence felt.
This morning, a few examples of Hong Kong-listed Chinese companies

Bitcoin Price Bullish after Halving-2024
On April 19, 2024, a halving occurred in the Bitcoin network, resulting in the reward for the mined block amounting to 3.125 BTC.
Historically, after the halving (which is associated with a reduction in supply), the price of Bitcoin