


FXOpen

GBP/USD found support near 1.3670 and it is now correcting higher. GBP/JPY is rising and it remains supported for more gains above 150.00
Important Takeaways for GBP/USD and GBP/JPY
- The British Pound declined below 1.3800, but it found support near 1.3670 against the US Dollar.
- There was a break above a major bearish trend line with resistance near 1.3740 on the hourly chart of GBP/USD.
- GBP/JPY is trading nicely above the 150.00 and 150.20 resistance levels.
- There was also a break above a key bearish trend line with resistance near 149.20 on the hourly chart.
GBP/USD Technical Analysis
This past week, the British Pound saw a bearish wave below the 1.3850 support zone against the US Dollar. The GBP/USD pair even broke the 1.3720 support level.
However, the pair found support near the 1.3670 zone. A low was formed near 1.3670 on FXOpen and the pair recently started a fresh increase. It broke the 1.3700 and 1.3720 resistance levels.
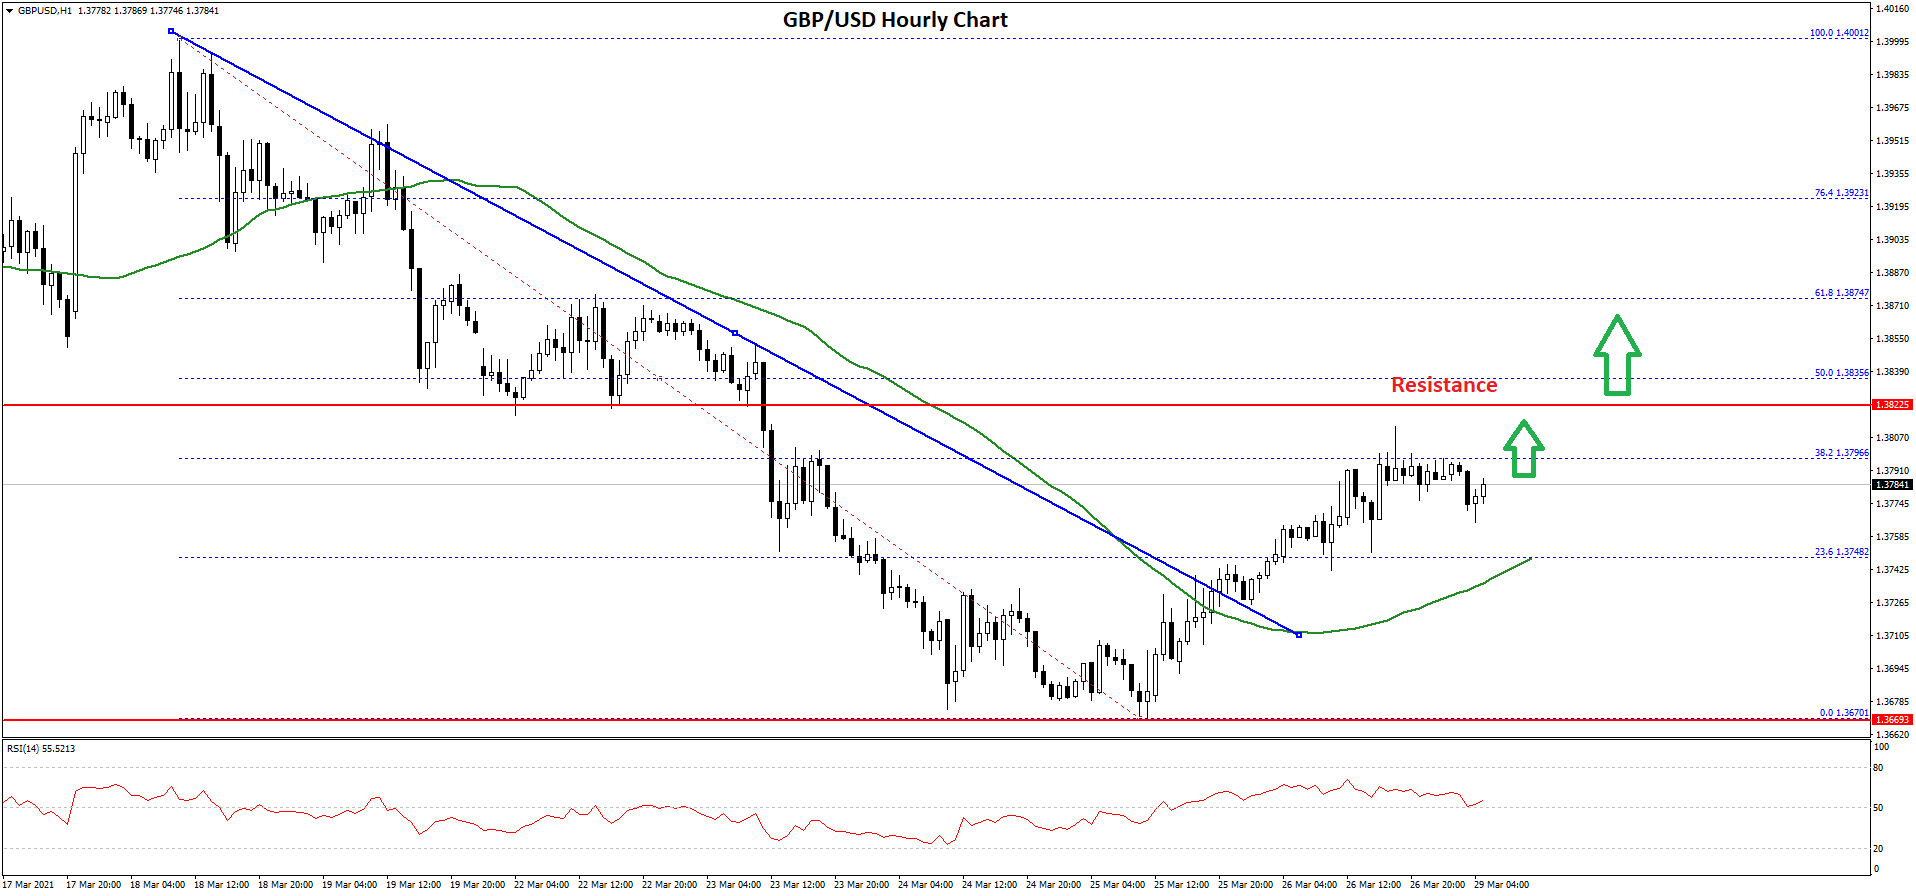
There was also a break above a major bearish trend line with resistance near 1.3740 on the hourly chart of GBP/USD. The pair is now trading nicely above the 1.3750 level and the 50 hourly simple moving average.
It is testing the 38.2% Fib retracement level of the key decline from the 1.4001 high to 1.3670 low. The first major resistance on the upside is near the 1.3825 level.
The next major resistance is near 1.3835 level or the 50% Fib retracement level of the key decline from the 1.4001 high to 1.3670 low. A clear upside break above the 1.3825 and 1.3835 resistance levels could open the doors for a larger increase.
If there is a fresh decline, the previous resistance near 1.3740 or the 50 hourly simple moving average might provide support. If there are additional losses, the pair could decline towards the 1.3700 level.
GBP/JPY Technical Analysis
The British Pound followed a similar pattern from the 148.50 zone against the Japanese Yen. The GBP/JPY pair traded as low as 148.52 before starting an upside correction.
The pair broke the 149.50 resistance level to move into a positive zone. There was a clear break above a key bearish trend line with resistance near 149.20 on the hourly chart. The pair surpassed the 50% Fib retracement level of the key decline from the 152.53 high to 148.52 low.

The pair settled nicely above the 150.00 level and the 50 hourly simple moving average. It even tested the 76.4% Fib retracement level of the key decline from the 152.53 high to 148.52 low.
GBP/JPY is now consolidating gains and trading inside a bullish flag with support near 150.90 on the same chart. If there is a downside break, the pair could test the 150.40 support.
The 50 hourly simple moving average is also near the 150.40 level. Any more losses might call for a test of the 150.00 level. On the upside, the pair is facing hurdles near the 151.50 and 151.60 levels.
A clear upside break above the 151.60 level could open the doors for a larger increase. In the stated case, the pair is likely to grind higher towards the 152.50 and 152.80 levels in the near term.
Trade over 50 forex markets 24 hours a day with FXOpen. Take advantage of low commissions, deep liquidity, and spreads from 0.0 pips. Open your FXOpen account now or learn more about trading forex with FXOpen.
This article represents the opinion of the Companies operating under the FXOpen brand only. It is not to be construed as an offer, solicitation, or recommendation with respect to products and services provided by the Companies operating under the FXOpen brand, nor is it to be considered financial advice.
Latest from Forex Analysis
Latest articles

Anchored VWAP and How You Can Use It in Forex Trading
In the world of forex trading, understanding the nuanced tools at your disposal can significantly enhance decision-making processes. One such sophisticated tool is the Anchored Volume-Weighted Average Price (Anchored VWAP), which refines the standard VWAP by allowing traders to set

META Share Price Collapses after Publication of Quarterly Report
Just yesterday, META's stock price closed at USD 493.50, up approximately 40% since the start of 2024 and up nearly 300% since the start of 2023.
However, following the release of Meta's quarterly report, its shares plummeted to USD

USD/JPY Analysis: The Rate Exceeds The Level of 155 Yen Per US Dollar
Today, the price of USD/JPY once again renewed its 34-year high, exceeding the level of 155 yen per dollar, which put pressure on the current authorities.
According to Reuters, officials are trying to maintain calm in the market.
"We