


FXOpen

GBP/USD is trading nicely above the main 1.4080 support zone. GBP/JPY is recovering and it could rally if there is a clear break above the 155.00 resistance zone.
Important Takeaways for GBP/USD and GBP/JPY
- The British Pound is trading in a range above the 1.4080 support against the US Dollar.
- There is a key bullish trend line forming with support near 1.4100 on the hourly chart of GBP/USD.
- GBP/JPY is showing a few positive signs above the 154.50 support zone.
- There is a major bearish trend line forming with resistance near 155.00 on the hourly chart.
GBP/USD Technical Analysis
In the past few sessions, the British Pound mostly traded in a range below the 1.4200 resistance zone against the US Dollar. The GBP/USD pair declined recently after it failed to settle above 1.4180.
There was break below the 1.4150 support level and the 50 hourly simple moving average. The pair even traded below 1.4100, but it remained well bid above the 1.4080 level. A low is formed near 1.4086 on FXOpen and the pair is currently consolidating.
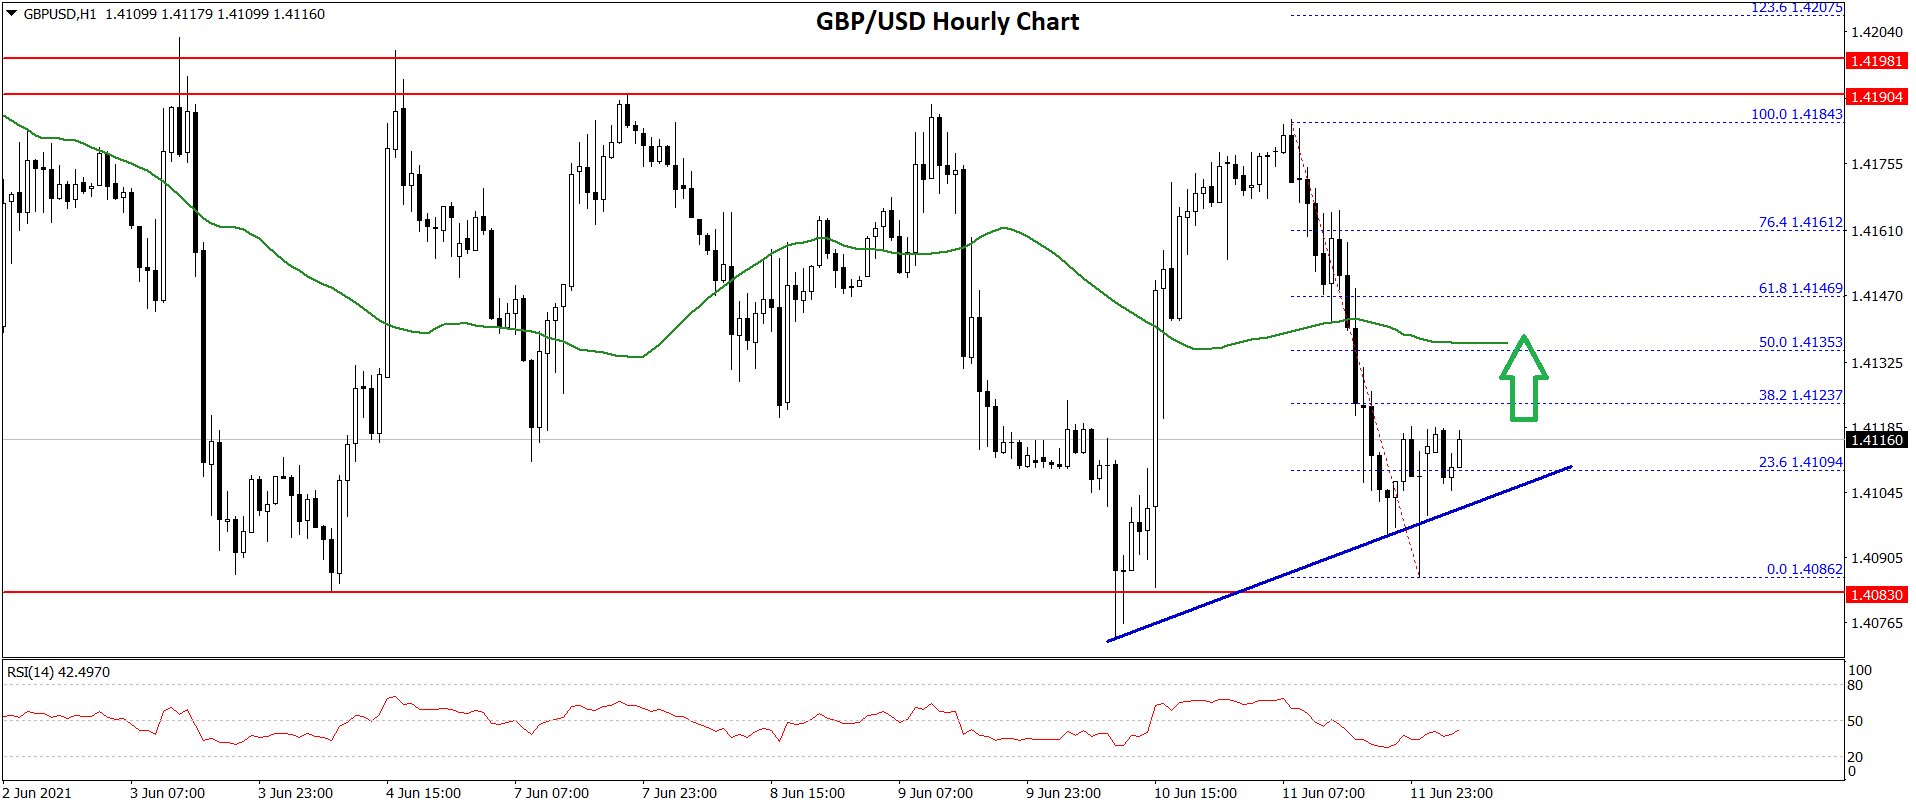
There was a break above the 1.4100 level. The pair recovered above the 23.6% Fib retracement level of the recent decline from the 1.4184 high to 1.4086 low.
On the upside, an initial resistance on the is near the 1.4135 level. It is close to the 50% Fib retracement level of the recent decline from the 1.4184 high to 1.4086 low. The next key resistance is near the 1.4150 level, above which the pair could rise towards the main 1.4200 resistance.
On the downside, there is a key bullish trend line forming with support near 1.4100 on the hourly chart of GBP/USD. If there is a break below the trend line support, the pair could test the 1.4080 support. If there are additional losses, the pair could decline towards the 1.4000 level.
GBP/JPY Technical Analysis
The British Pound started a steady decline from well above 155.50 against the Japanese Yen. The GBP/JPY pair traded below the 155.00 support zone.
It even traded below 154.50 before it found support near 154.10. A low was formed near 154.13 before the pair recovered above 154.80. The pair traded as high as 155.21 and it is currently correcting lower.
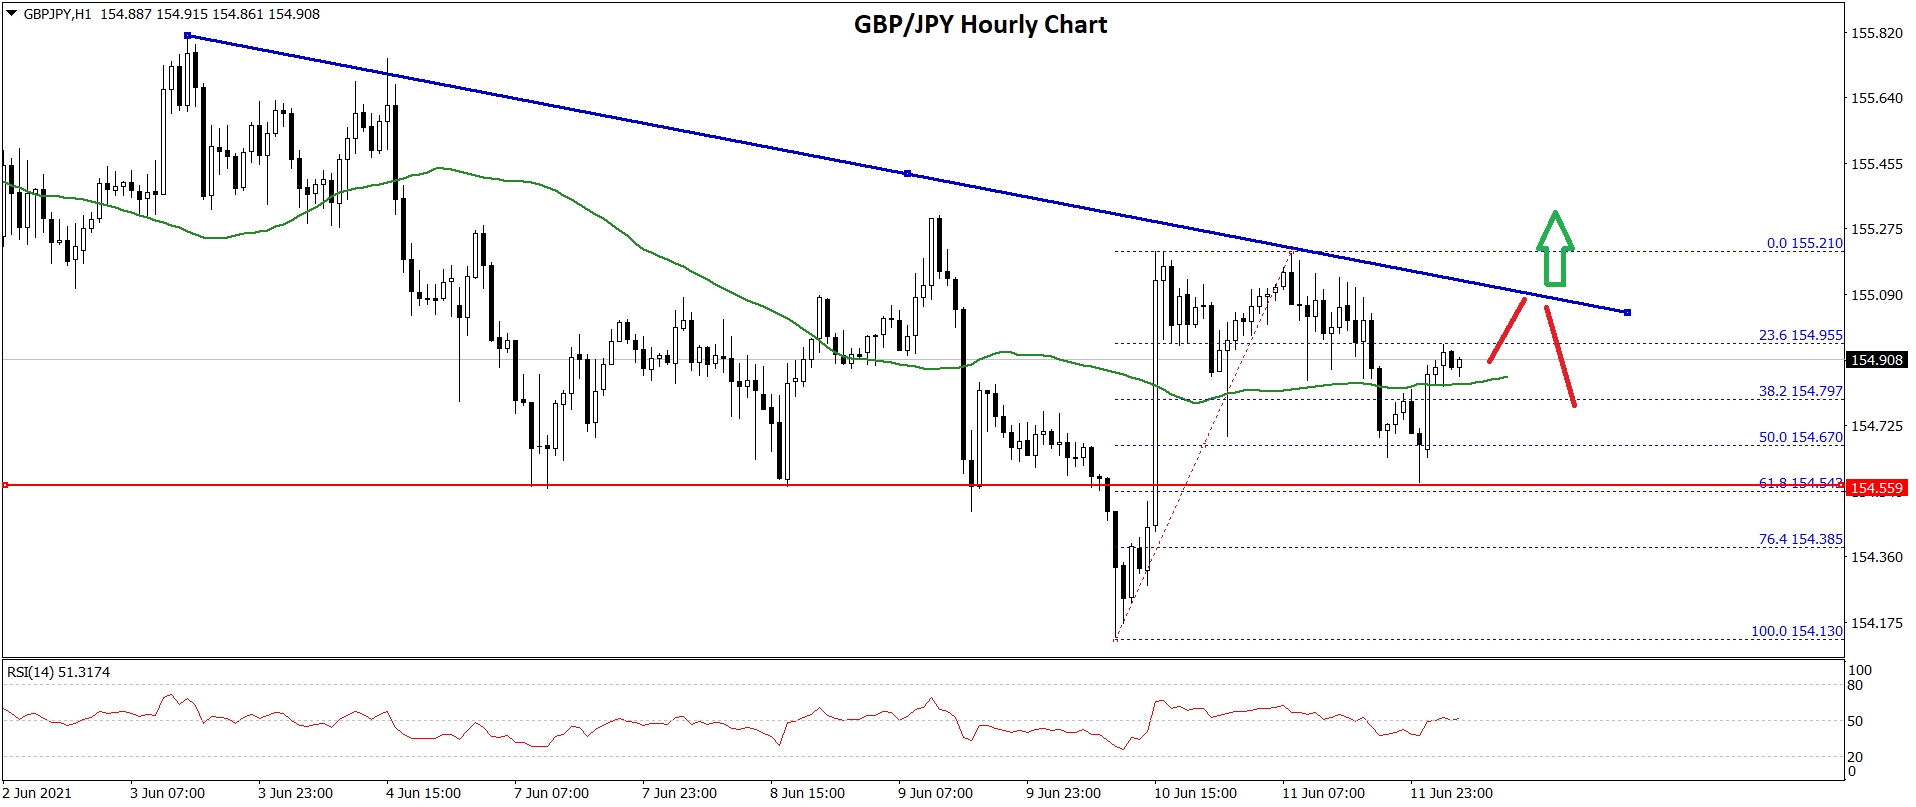
There was a spike below the 154.80 level and the 50 hourly simple moving average. It even declined below the 50% Fib retracement level of the upward move from the 154.13 swing low to 155.21 high. However, the bulls protected the 154.50 level.
The 61.8% Fib retracement level of the upward move from the 154.13 swing low to 155.21 high is also acting as a support. On the upside, the pair is facing a key hurdle near 155.00.
There is also a major bearish trend line forming with resistance near 155.00 on the hourly chart. A clear break above the trend line could open the doors for a steady increase towards the 155.50 and 155.60 levels.
If not, there is a risk of a fresh decline below the 154.50 support. The next major support sits near the 154.00 level, where the bulls might take a stand. Any more losses might call for a test of the 153.65 level.
This forecast represents FXOpen Markets Limited opinion only, it should not be construed as an offer, invitation or recommendation in respect to FXOpen Markets Limited products and services or as financial advice.
Trade over 50 forex markets 24 hours a day with FXOpen. Take advantage of low commissions, deep liquidity, and spreads from 0.0 pips. Open your FXOpen account now or learn more about trading forex with FXOpen.
This article represents the opinion of the Companies operating under the FXOpen brand only. It is not to be construed as an offer, solicitation, or recommendation with respect to products and services provided by the Companies operating under the FXOpen brand, nor is it to be considered financial advice.
Latest from Forex Analysis
Latest articles

What Is a Break of Structure and How Can You Trade It?
In the ever-evolving world of Smart Money Concept (SMC) trading, a nuanced understanding of market dynamics is indispensable. This article explores the concept of Break of Structure (BOS), how to identify it, and its implications for trading strategies, setting traders

Hong Kong Stocks Become Top Risers After Wild Ride Subsides
Hong Kong enjoyed a sterling reputation for an entire century as a highly polished, utterly stable mantlepiece upon which global corporations could comfortably sit and where an international talent base could reside in fabulous surroundings and approach European, American, African

Brent Oil Price Did Not Rise Despite Iran's Attack on Israel
As you know, Iran launched a missile attack on Israel over the weekend. This could greatly increase the price of Brent oil, given that Iran is one of the top 10 oil producing countries, and the fact of the strike