


FXOpen

GBP/USD remained strong above 1.3700, but it is facing hurdles near 1.3750. GBP/JPY is gaining momentum and it is trading well above 144.00.
Important Takeaways for GBP/USD and GBP/JPY
- The British Pound settled above the 1.3700 resistance zone against the US Dollar.
- There is a rising channel forming with support near 1.3718 on the hourly chart of GBP/USD.
- GBP/JPY gained momentum after it broke 143.80 and 144.00.
- There was a break below a major declining channel with resistance near 143.30 on the hourly chart.
GBP/USD Technical Analysis
This past week, the British Pound corrected lower below 1.3700 and 1.3600 against the US Dollar. However, the GBP/USD pair remained well bid above the 1.3550 level.
Recently, there was a fresh increase above the 1.3600 and 1.3650 resistance levels. There was also a break above a major bearish trend line with resistance near 1.3635 on the hourly chart of GBP/USD.
The pair settled nicely above 1.3700 and the 50 hourly simple moving average. A high was formed near 1.3740 on FXOpen and the pair is currently consolidating gains. An initial support is near the 1.3720 level. There is also a rising channel forming with support near 1.3718 on the same chart.
The channel support is close to the 23.6% Fib retracement level of the upward move from the 1.3651 low to 1.3740 high. If there is a downside break below the channel support could open the doors for a corrective wave towards the 1.3700 and 1.3680 levels.
The 50% Fib retracement level of the upward move from the 1.3651 low to 1.3740 high is also near the 1.3695 level to provide support. The next major support is near the 1.3670 level, below which the pair could decline towards the 1.3650 level.
On the upside, the first key resistance is forming near the 1.3750 level. The next major resistance is near the 1.3800 level, above which the pair could continue to rise towards the 1.3840 and 1.3880 levels. Any more upsides could push the pair towards 1.3920.
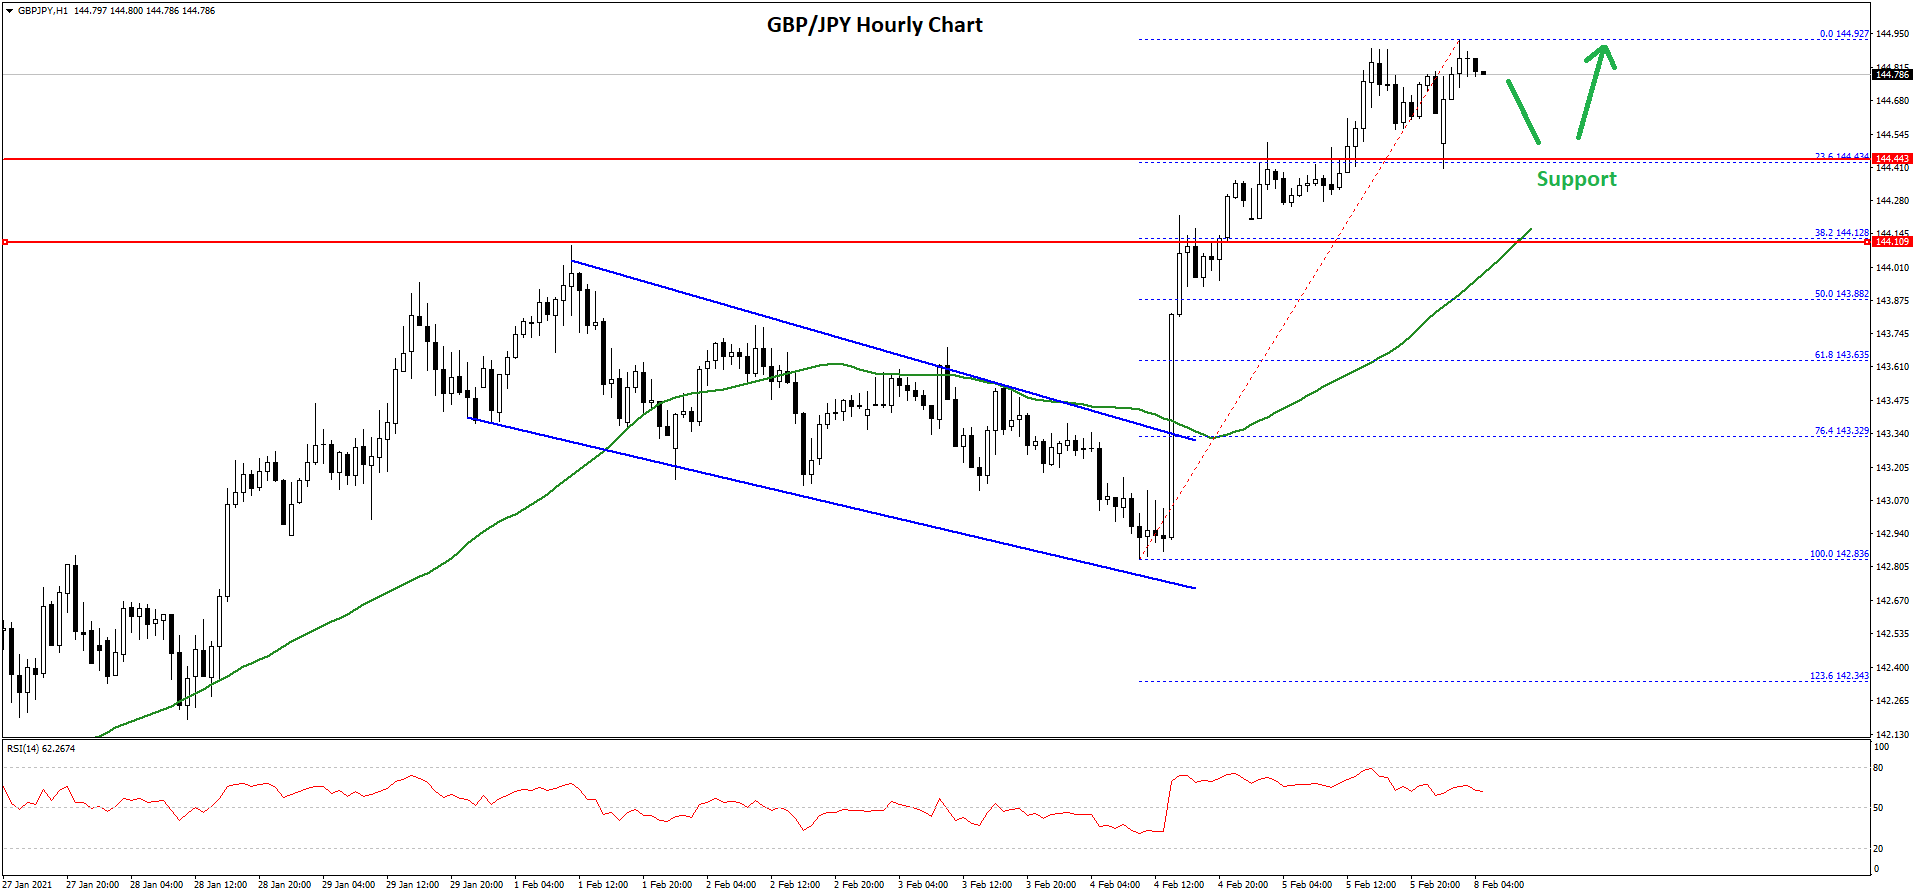
GBP/JPY Technical Analysis
The British Pound started a strong increase from the 142.80 swing low against the Japanese Yen. The GBP/JPY pair traded above the 143.20 and 143.50 resistance levels to move into a positive zone.
There break below a major declining channel with resistance near 143.30 on the hourly chart. The pair settled nicely above the 144.00 level and the 50 hourly simple moving average. The pair even cleared the 144.50 resistance zone and it traded close to the 145.00.
A high is formed near 144.92 and the pair is consolidating gains. An initial support on the downside is near the 144.50 level. The 23.6% Fib retracement level of the upward move from the 142.83 swing low to 144.92 high.
The next key support is near the 144.10 level and the 50 hourly simple moving average. The 38.2% Fib retracement level of the upward move from the 142.83 swing low to 144.92 high is also near the 50 hourly SMA.
On the upside, the pair is facing hurdles near 144.90 and 145.00. A clear break above the 145.00 zone could open the doors for a steady increase. The next major resistance is near the 145.50 level.
Trade over 50 forex markets 24 hours a day with FXOpen. Take advantage of low commissions, deep liquidity, and spreads from 0.0 pips. Open your FXOpen account now or learn more about trading forex with FXOpen.
This article represents the opinion of the Companies operating under the FXOpen brand only. It is not to be construed as an offer, solicitation, or recommendation with respect to products and services provided by the Companies operating under the FXOpen brand, nor is it to be considered financial advice.
Latest from Forex Analysis
Latest articles

AUD/USD Rises Sharply on Inflation News
The Consumer Price Index for Australia was released this morning. According to ForexFactory:
→ CPI in quarterly terms: actual = 1.0%, expected = 0.8%, previous value = 0.6%;
→ CPI in annual terms: actual = 3.5%, expected = 3.4%, previous value = 3.

TSLA Share Price Up About 13% Despite Disappointing Report
Yesterday, TSLA trading closed at USD 144.68 per share, after which Tesla reported its results for the 1st quarter:
→ earnings per share: actual = USD 0.45, forecast = USD 0.49;
→ gross income: actual = USD 21.45 billion, forecast = USD

Market Analysis: Gold Price Corrects Gains While Oil Price Regains Strength
Gold price rallied above $2,400 before correcting lower. Crude oil price is rising and it could climb further higher toward the $85.50 resistance.
Important Takeaways for Gold and Oil Prices Analysis Today
· Gold price rallied significantly above $2,