


FXOpen

GBP/USD is slowly recovering, but it must break 1.3850 for more upsides. Similarly, GBP/JPY could gain pace if it clears the 1.3850 resistance zone in the near term.
Important Takeaways for GBP/USD and GBP/JPY
- The British Pound is attempting a decent recovery wave above the 1.3800 zone against the US Dollar.
- There is a key bearish trend line forming with resistance near 1.3835 on the hourly chart of GBP/USD.
- GBP/JPY seems to be forming a base above the 153.00 support zone.
- There was a break above a major bearish trend line with resistance near 153.40 on the hourly chart.
GBP/USD Technical Analysis
In the past few sessions, the British Pound saw bearish moves below the 1.4000 zone against the US Dollar. The GBP/USD pair traded below many supports near 1.3900 and 1.3850 to move into a bearish zone.
The pair even traded below the 1.3800 level and the 50 hourly simple moving average. A low is formed near 1.3731 on FXOpen and the pair is currently correcting losses. There was a break above the 1.3780 resistance zone.
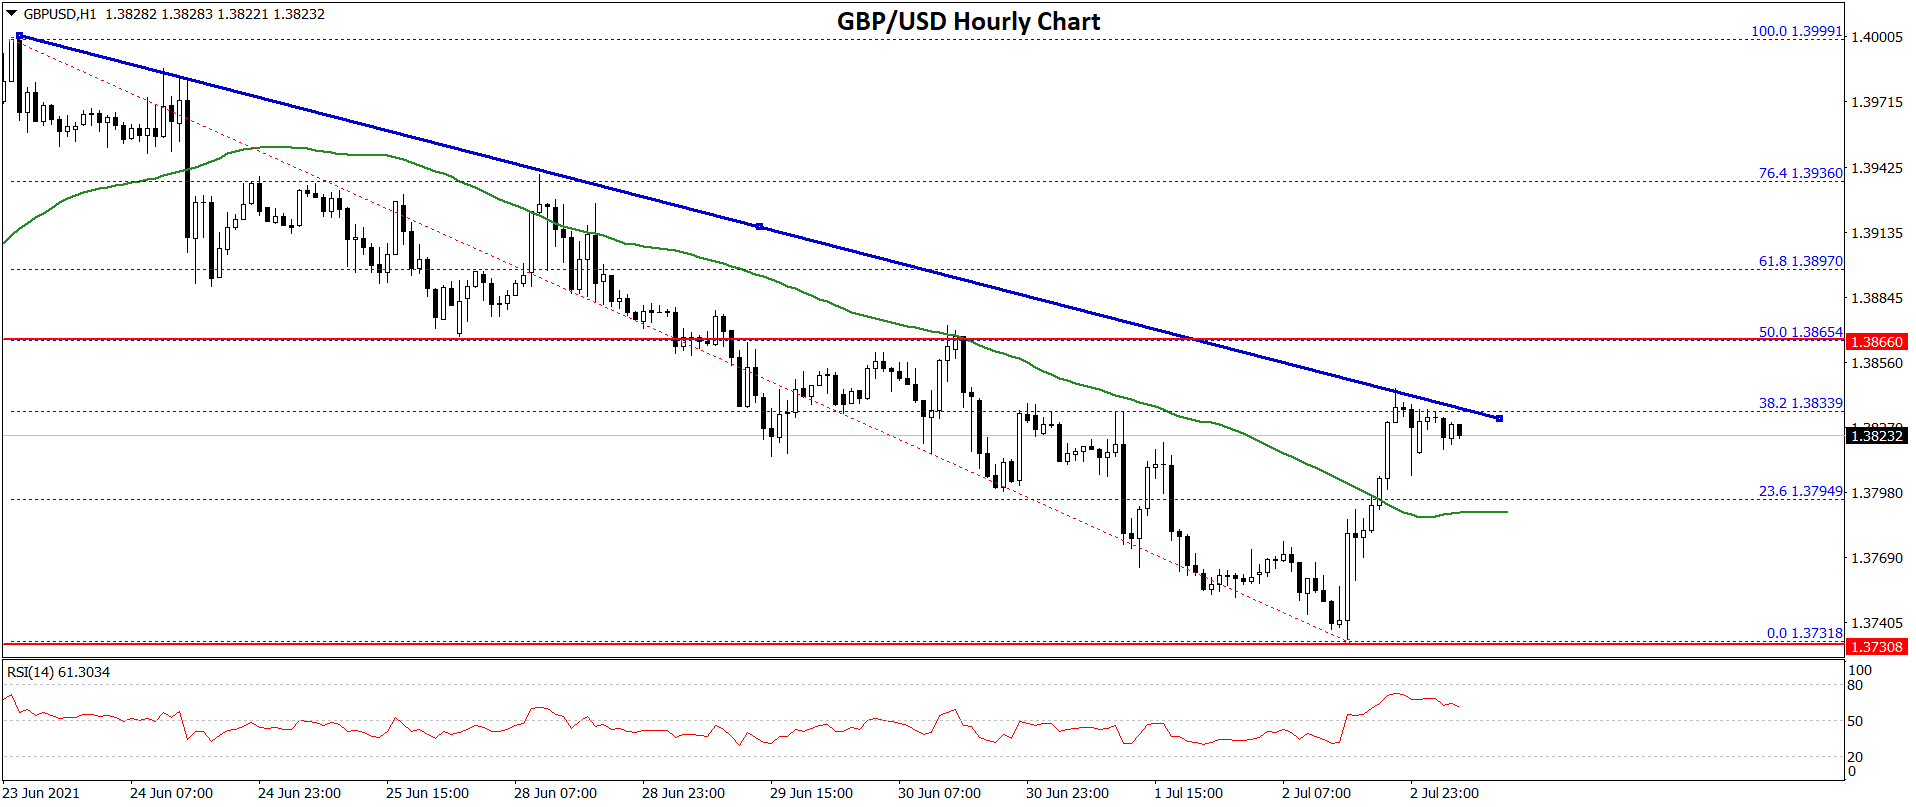
The pair recovered above the 23.6% Fib retracement level of the key decline from the 1.3999 high to 1.3731 low. The pair is now trading above the 1.3800 zone and the 50 hourly simple moving average.
On the upside, an initial resistance on the is near the 1.3835 level. There is also a key bearish trend line forming with resistance near 1.3835 on the hourly chart of GBP/USD. The next major resistance is near the 1.3850 level.
The main resistance is near 1.3865 level. It is close to the 50% Fib retracement level of the key decline from the 1.3999 high to 1.3731 low. The next key resistance is near the 1.3900 level, above which the pair could rise towards the main 1.4000 resistance.
On the downside, an initial support is near the 1.3800 level and the 50 hourly SMA. If there is a break below the 1.3800 support, the pair could test the 1.3750 support. If there are additional losses, the pair could decline towards the 1.3640 level.
GBP/JPY Technical Analysis
The British Pound also followed a similar path after it declined from well above 155.00 against the Japanese Yen. The GBP/JPY pair traded below the 153.50 support zone.
It even traded below 153.00 before it found support near 152.60. A low was formed near 152.62 before the pair recovered above 153.00. There was a break above a major bearish trend line with resistance near 153.40 on the hourly chart.
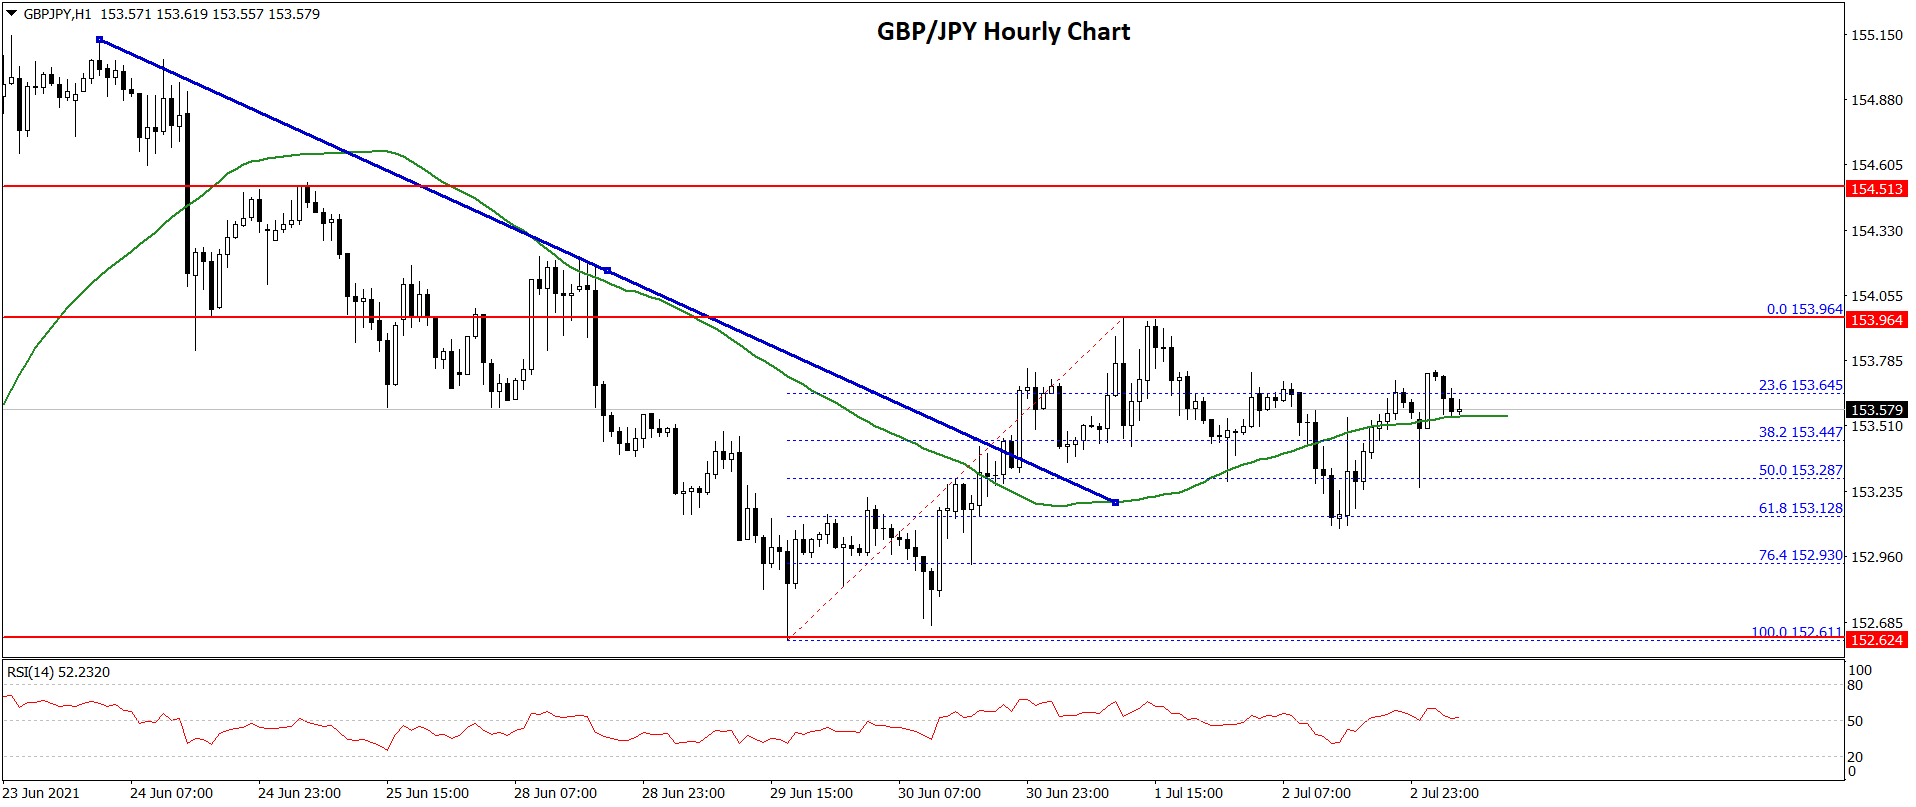
The pair even traded above the 153.50 level and the 50 hourly simple moving average. However, the bears protected the 154.00 zone. A high was formed near 153.96 before the pair corrected lower.
There was a break below the 50% Fib retracement level of the upward move from the 152.62 swing low to 153.96 high. However, the bulls protected the 153.00 level.
The 61.8% Fib retracement level of the upward move from the 152.62 swing low to 153.96 high is also acting as a support. On the upside, the pair is facing a key hurdle near 154.00. A clear break above the 154.00 barrier could open the doors for a steady increase towards the 154.50 and 154.60 levels. The main resistance is still near the 155.00 level.
This forecast represents FXOpen Markets Limited opinion only, it should not be construed as an offer, invitation or recommendation in respect to FXOpen Markets Limited products and services or as financial advice.
Trade over 50 forex markets 24 hours a day with FXOpen. Take advantage of low commissions, deep liquidity, and spreads from 0.0 pips. Open your FXOpen account now or learn more about trading forex with FXOpen.
This article represents the opinion of the Companies operating under the FXOpen brand only. It is not to be construed as an offer, solicitation, or recommendation with respect to products and services provided by the Companies operating under the FXOpen brand, nor is it to be considered financial advice.
Latest from Forex Analysis
Latest articles

Weekly Market Wrap With Gary Thomson: UK100, USD, GOLD, OIL
Get the latest scoop on the week's hottest headlines, all in one convenient video. Join Gary Thomson, the COO of FXOpen UK, as he breaks down the most significant news reports and shares his expert insights.
- UK100 Share Index Rises

What Is a Darvas Box Theory and How Does It Work in Trading?
The Darvas Box Theory, pioneered by Nicolas Darvas in the 1950s, has transcended its stock market origins to become a valuable tool for forex traders. This method leverages specific price movements and patterns, known as the Darvas Box, to track

NFLX Stock Price Falls Despite Subscriber Growth
Yesterday, after the close of the main trading session on the stock market, Netflix reported to investors for the 1st quarter of 2024.
The report turned out better than expected:
→ earnings per share: actual = USD 5.28, forecast = USD 4.