


FXOpen

GBP/USD started a decent recovery from the 1.2250 support zone and climbed above 1.2350. GBP/JPY is also rising, but facing hurdles near the 133.50 level.
Important Takeaways for GBP/USD and GBP/JPY
- The British Pound is currently correcting higher and testing the 1.2400-1.2410 resistance zone.
- There was a break above a major bearish trend line with resistance near 1.2365 on the hourly chart of GBP/USD.
- GBP/JPY is currently facing a strong resistance near the 133.50 and 133.80 levels.
- There is a major bearish trend line forming with resistance near 133.45 on the hourly chart.
GBP/USD Technical Analysis
This past week, the British Pound followed a bearish path and traded below the 1.2425 support area against the US Dollar. The GBP/USD pair broke the 1.2350 support level before it found support above 1.2250.
Recently, there was a decent recovery wave above the 1.2300 level. The pair broke the 1.2350 resistance level and the 50 hourly simple moving average. The recent swing low was formed near 1.2298 on FXOpen before it climbed above 1.2350.
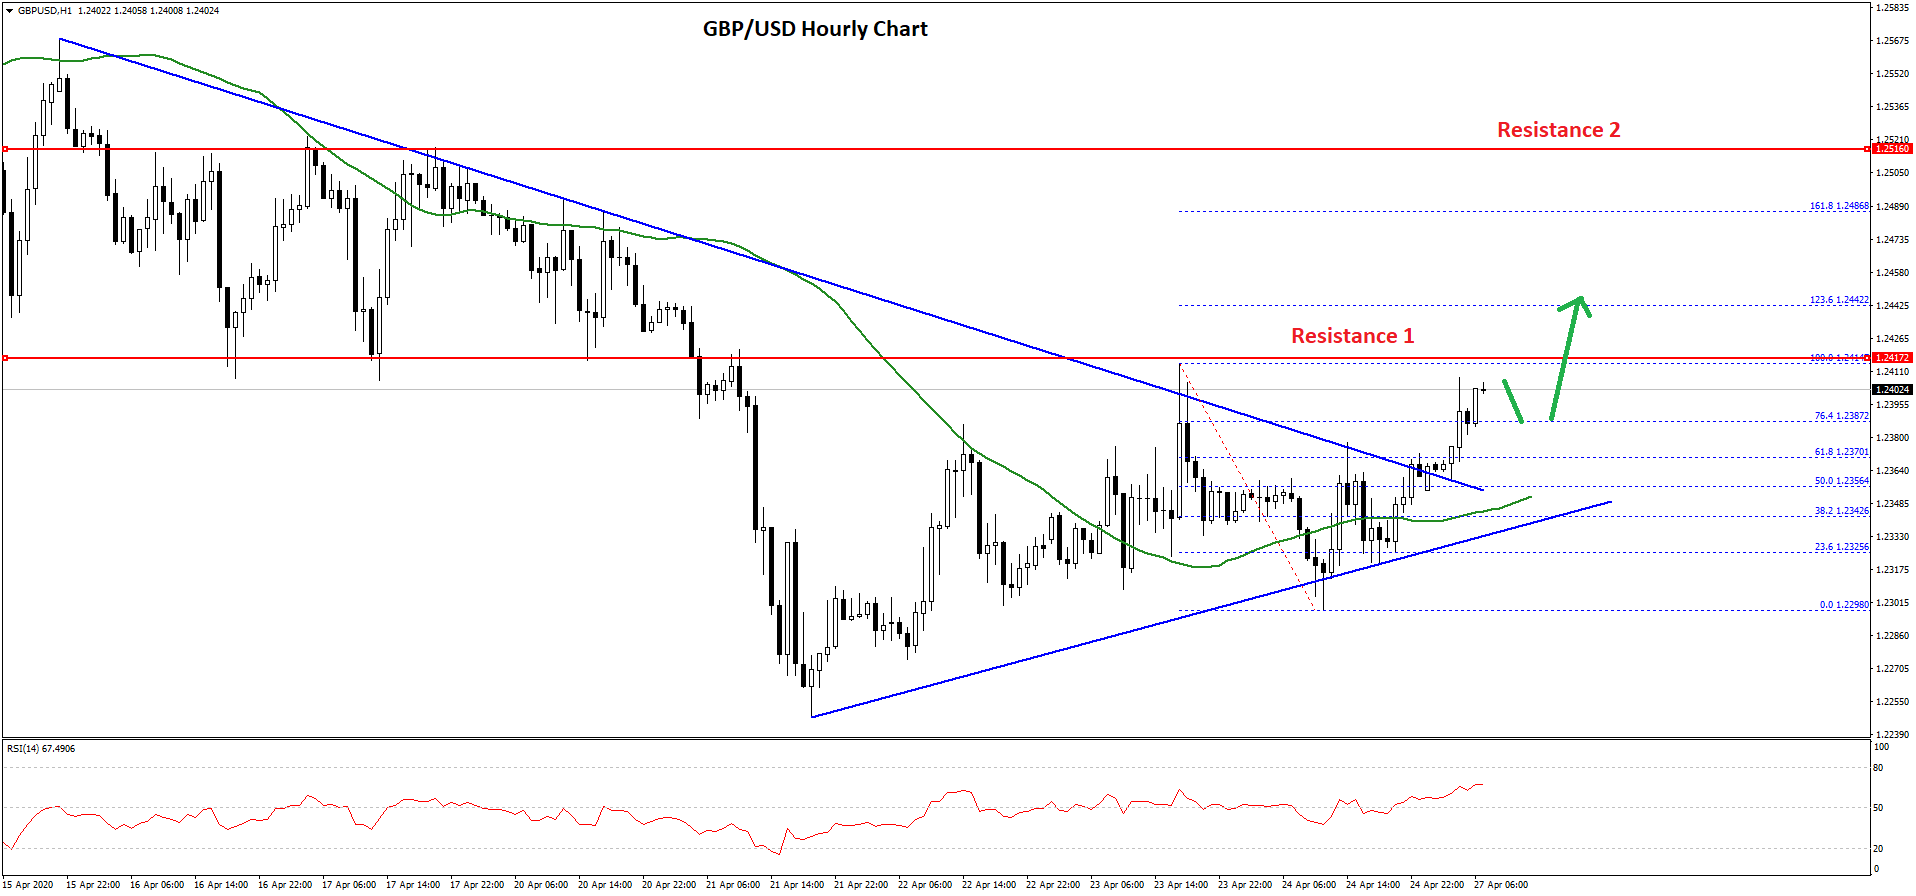
There was a break above the 76.4% Fib retracement level of the downward move from the 1.2414 high to 1.2298 high. Besides, there was a break above a major bearish trend line with resistance near 1.2365 on the hourly chart of GBP/USD.
The pair is now approaching the 1.2410 resistance area and the last swing high. It seems like there is a major hurdles forming near 1.2410-1.2425. A successful close above the 1.2425 pivot level might push the pair further higher.
The next key resistance is near the 1.2480. It is close to the 1.618 Fib extension level of the downward move from the 1.2414 high to 1.2298 high.
Any further gains could lead the pair towards the 1.2500 and 1.2520 levels. Conversely, the pair may fail to surpass the 1.2425 resistance and it might decline back towards the 1.2350 support area or the 50 hourly SMA.
GBP/JPY Technical Analysis
The British Pound also followed a similar path this past week and tested the 132.00 support area against the Japanese Yen. The GBP/JPY pair traded as low as 131.90 and recently started a nice upward move.
There was a break above the 132.40 and 132.50 resistance levels. Besides, the pair surpassed the 133.00 level and the 50 hourly simple moving average.
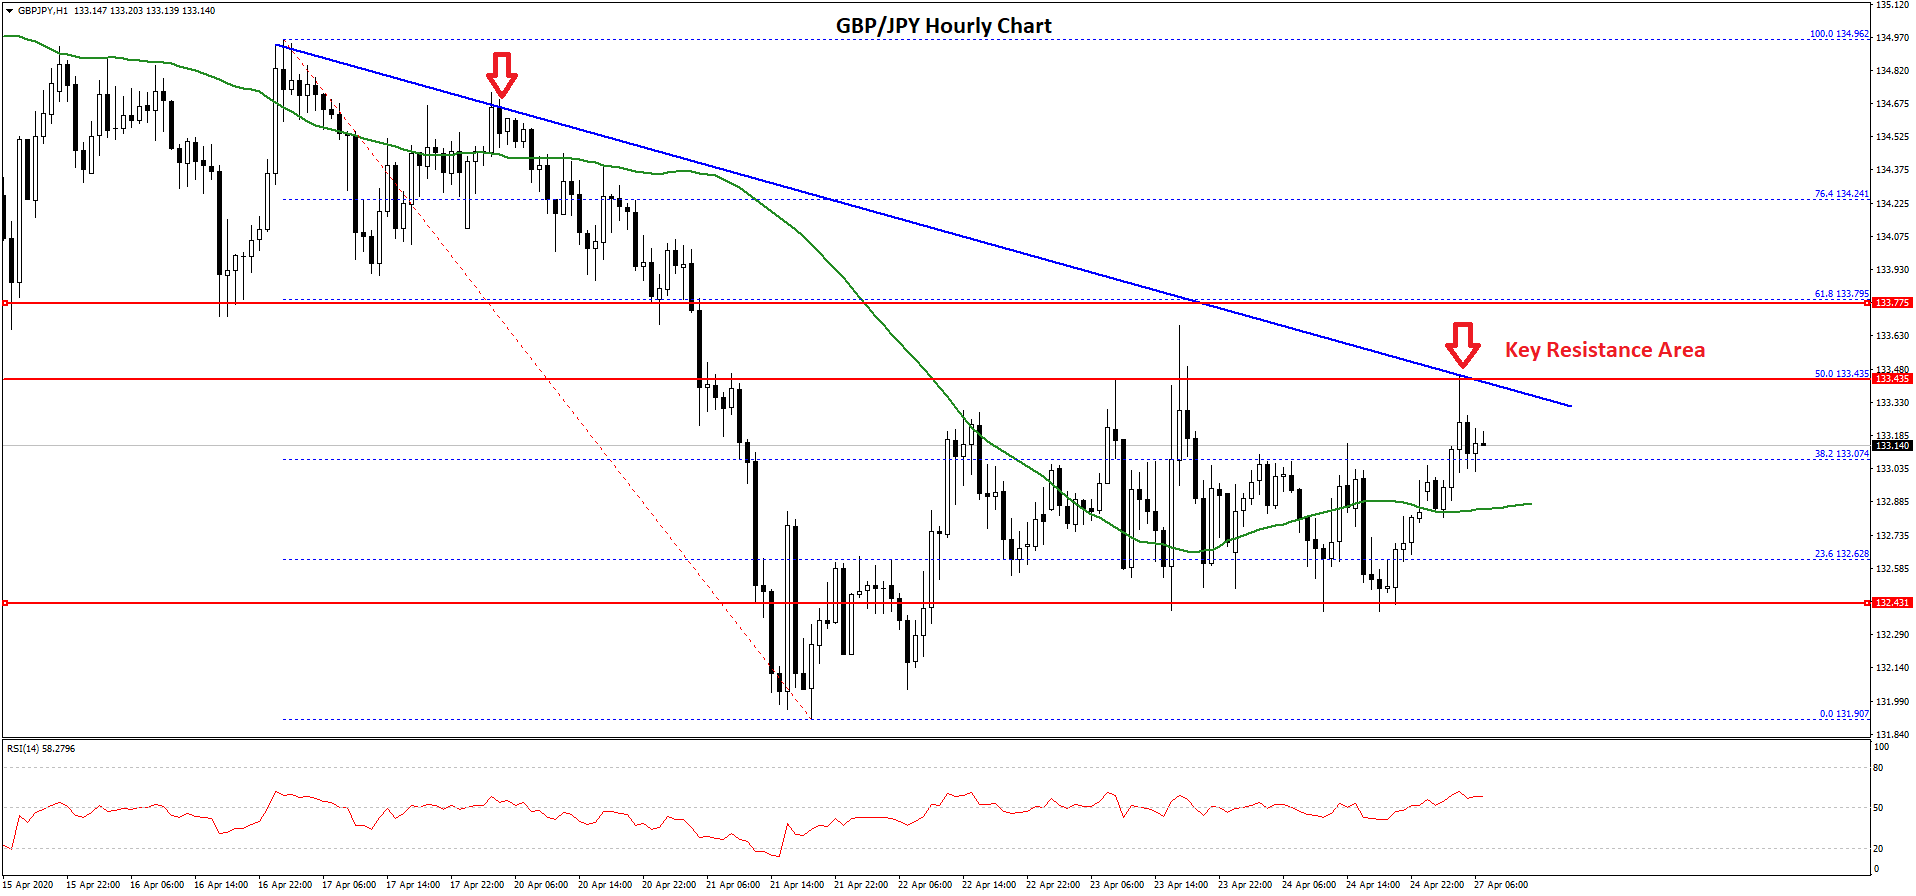
There was a break above the 38.2% Fib retracement level of the downward move from the 134.96 swing high to 131.90 low. However, the pair is now facing a strong resistance near the 133.40-133.50 zone (the previous support).
More importantly, there is a major bearish trend line forming with resistance near 133.45 on the hourly chart. The trend line is close to the 50% Fib retracement level of the downward move from the 134.96 swing high to 131.90 low.
If the pair clears the 133.45 resistance, it could test the next hurdle near the 133.80 level. A successful close above the 133.80 resistance is needed for more upsides towards the 134.00 and 134.50 levels in the near term.
On the other hand, GBP/JPY might struggle to clear the 133.45 and 133.80 resistance levels. On the downside, an initial support is near the 132.80 level, below which the pair might find support near 132.40. Any further losses could lead the pair towards 132.00.
Trade over 50 forex markets 24 hours a day with FXOpen. Take advantage of low commissions, deep liquidity, and spreads from 0.0 pips. Open your FXOpen account now or learn more about trading forex with FXOpen.
This article represents the opinion of the Companies operating under the FXOpen brand only. It is not to be construed as an offer, solicitation, or recommendation with respect to products and services provided by the Companies operating under the FXOpen brand, nor is it to be considered financial advice.
Latest from Forex Analysis
Latest articles

Google Share Price Rose Post-market to a New All-time Record
Yesterday, after the close of the main trading session, a report on activities for the 1st quarter of Alphabet Inc. (Google's parent company) was published. The report was strong, exceeding investors' expectations.
→ Quarterly EPS = USD 1.89 (expected = USD 1.

S&P 500 Rebounds after Negative GDP News
Data released yesterday showed US GDP growth slowed to 1.6% in the first quarter of the year. According to ForexFactory: forecast = 2.2%, past value = 2.4%.
Reaction to the news sent the S&P 500 mini stock

GBP/USD And USD/CAD Daily Chart Outlook
GBP/USD is attempting a recovery wave from 1.2300. USD/CAD is consolidating and might aim for a move above the 1.3760 resistance zone.
Important Takeaways for GBP/USD and USD/CAD Analysis Today
· The British Pound started