


FXOpen
GBP/USD started a strong increase above the 1.3500 resistance zone. GBP/JPY also gained traction and it gained pace above the 140.00 resistance zone to move into a positive zone.
Important Takeaways for GBP/USD and GBP/JPY
- The British Pound climbed higher above the 1.3500 and 1.3550 resistance levels.
- There is a key bullish trend line forming with support near 1.3555 on the hourly chart of GBP/USD.
- GBP/JPY also climbed higher steadily above the 139.50 and 140.00 resistance levels.
- There is a major bullish trend line forming with support near 140.30 on the hourly chart.
GBP/USD Technical Analysis
This past week, the British Pound saw a strong increase from the 1.3300 support zone against the US Dollar. The GBP/USD pair broke the 1.3500 resistance zone to move further into a positive zone.
The upward move was such that the pair even broke the 1.3550 resistance and settled above the 50 hourly simple moving average. It traded as high as 1.3618 on FXOpen and it is currently consolidating gains.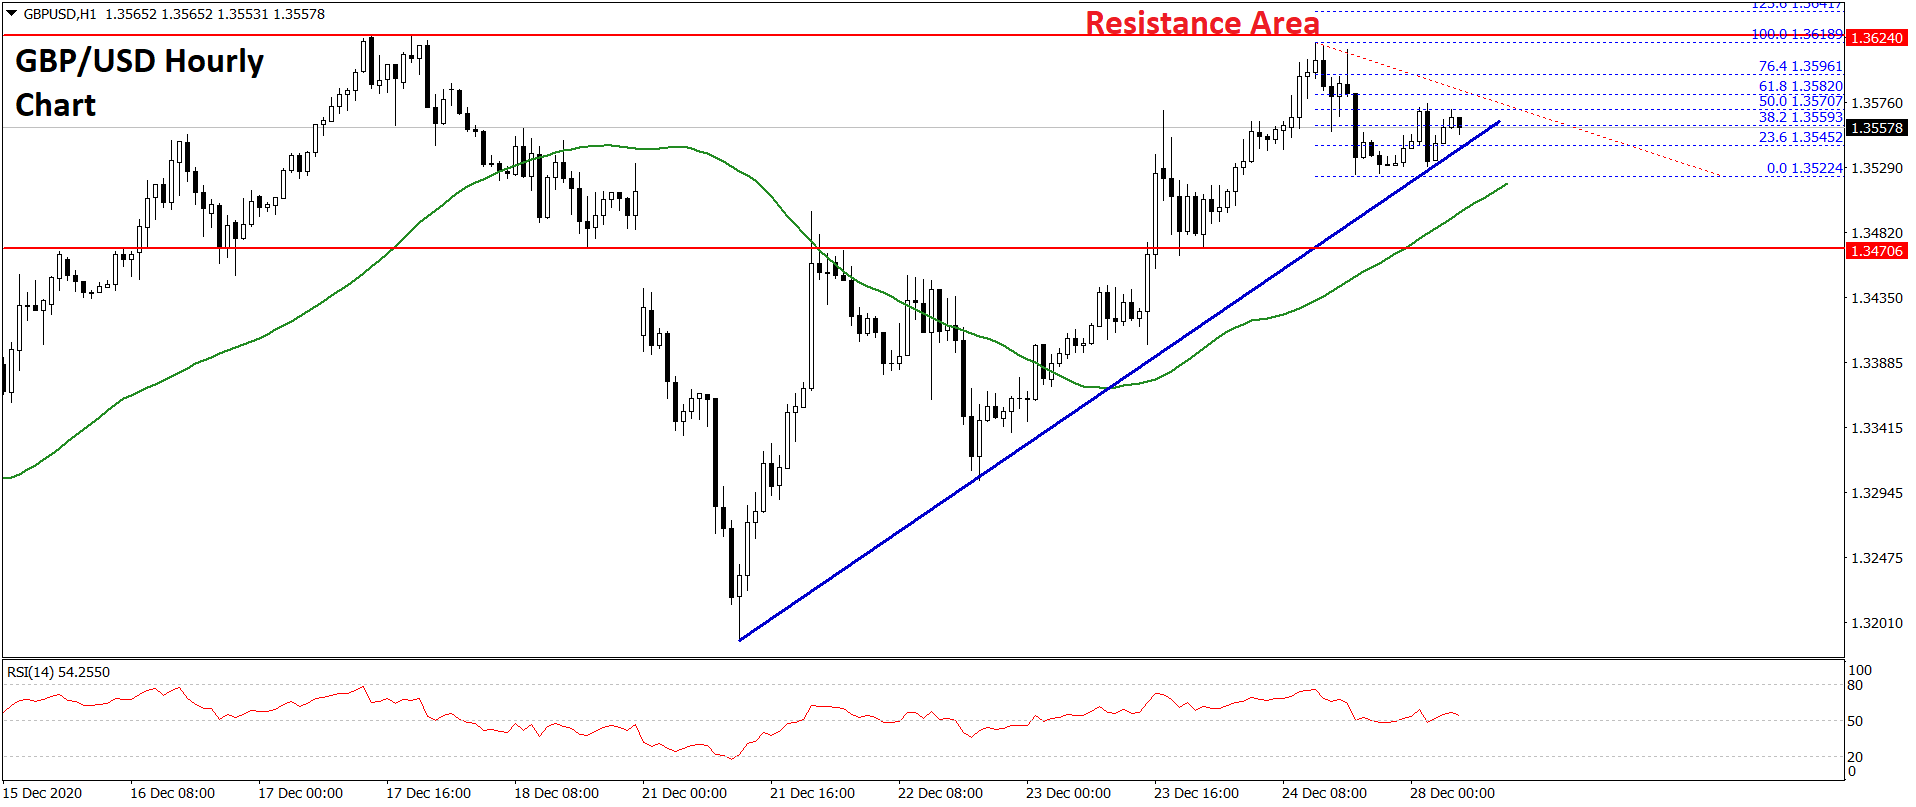
It corrected lower towards 1.3520 and traded as low as 1.3522. Recently, there was a minor increase above the 1.3540 level. The pair climbed above the 1.3550 level, and tested the 50% Fib retracement level of the recent decline from the 1.3618 high to 1.3522 low.
The first major resistance is near the 1.3580 level. It is close to the 61.8% Fib retracement level of the recent decline from the 1.3618 high to 1.3522 low.
On the upside, a clear break above the 1.3600 resistance level is needed for more upsides. The next major resistance is near the 1.3650 level, above which the pair could rise towards the 1.3680 and 1.3700 levels.
On the downside, there is a key bullish trend line forming with support near 1.3555 on the hourly chart of GBP/USD. If there is a downside break below the trend line support, the pair could continue to move down towards the 1.3500 support level in the near term.
GBP/JPY Technical Analysis
The British Pound also climbed nicely from the 137.50 support level against the Japanese Yen. The GBP/JPY pair climbed above the 138.50 level to start a steady increase.
It gained pace above the 139.20 resistance and settled above the 50 hourly simple moving average. It even spiked above the 141.00 level and traded as high as 141.21 before correcting lower. There was a break below the 140.50 support level.
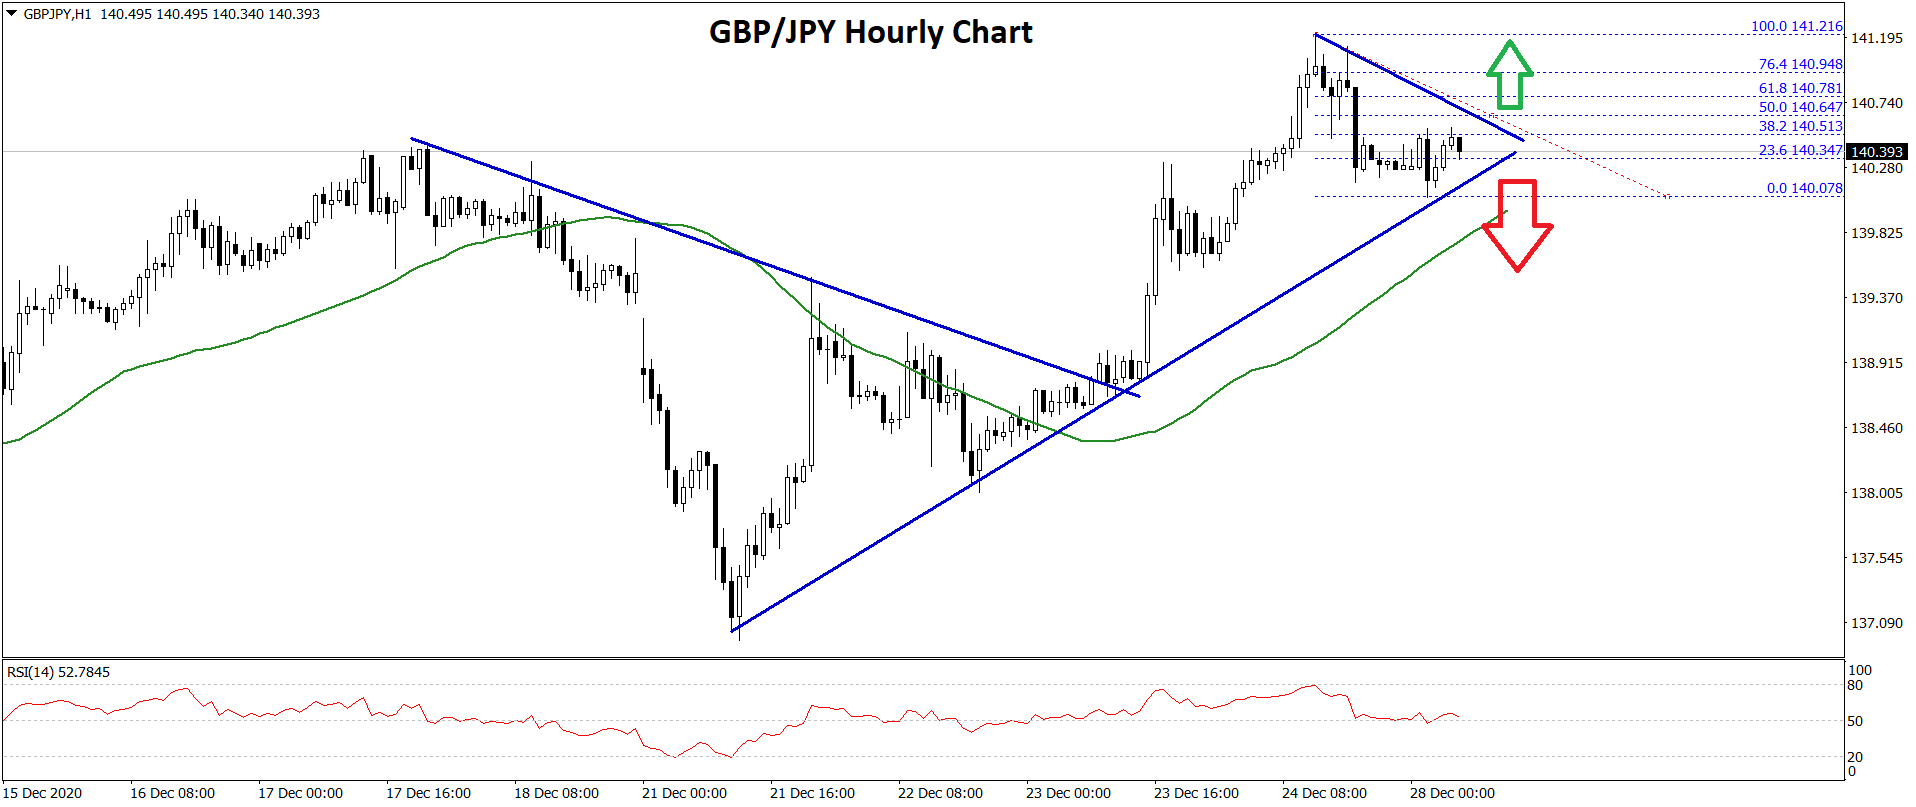
However, the pair remained stable above 140.00 and a low is formed near 140.07. The pair is currently rising and trading above the 23.6% Fib retracement level of the recent decline from the 141.21 high to 140.07 low.
The pair is now facing hurdles near the 140.50 and 140.60 levels. The 50% Fib retracement level of the recent decline from the 141.21 high to 140.07 low is also near the 140.60 zone.
A clear break above the 140.60 resistance could open the doors for a fresh increase. In the stated case, the pair could rise above the 141.00 and 141.20 resistance levels.
On the downside, there is a major bullish trend line forming with support near 140.30 on the hourly chart. If there is a downside break below the trend line support, GBP/JPY could retest the 138.50 support level.
Trade over 50 forex markets 24 hours a day with FXOpen. Take advantage of low commissions, deep liquidity, and spreads from 0.0 pips. Open your FXOpen account now or learn more about trading forex with FXOpen.
This article represents the opinion of the Companies operating under the FXOpen brand only. It is not to be construed as an offer, solicitation, or recommendation with respect to products and services provided by the Companies operating under the FXOpen brand, nor is it to be considered financial advice.
Latest from Forex Analysis
Latest articles

What Is a Darvas Box Theory and How Does It Work in Trading?
The Darvas Box Theory, pioneered by Nicolas Darvas in the 1950s, has transcended its stock market origins to become a valuable tool for forex traders. This method leverages specific price movements and patterns, known as the Darvas Box, to track

NFLX Stock Price Falls Despite Subscriber Growth
Yesterday, after the close of the main trading session on the stock market, Netflix reported to investors for the 1st quarter of 2024.
The report turned out better than expected:
→ earnings per share: actual = USD 5.28, forecast = USD 4.

Escalation Between Iran and Israel: How the Price of Brent Oil Reacts
On the night of Thursday into Friday, reports emerged that Israel had attacked Iran following Iran's attack on Israel over the weekend.
Let's remember that we wrote on Monday that after a 300 drone and missile attack on Israel over