


FXOpen

GBP/USD is following a declining pattern below the 1.3300 resistance zone. GBP/JPY is also struggling to clear the 141.20 resistance and it could extend its decline.
Important Takeaways for GBP/USD and GBP/JPY
- The British Pound started a substantial decline after trading close to 1.3500.
- There is a major bearish trend line forming with resistance near 1.3255 on the hourly chart of GBP/USD.
- GBP/JPY also declined and it traded close to the 140.00 support zone.
- There is a key bearish trend line forming with resistance near 140.95 on the hourly chart.
GBP/USD Technical Analysis
This past week, the British Pound gained traction above the 1.3300 resistance against the US Dollar. GBP/USD even broke the 1.3400 resistance, but it failed to test the 1.3500 resistance zone.
It started a downside correction and traded below the 1.3400 support. The decline gained pace below the 1.3320 support and the 50 hourly simple moving average. The pair even spiked below the 1.3200 support level and traded as low as 1.3175 on FXOpen.
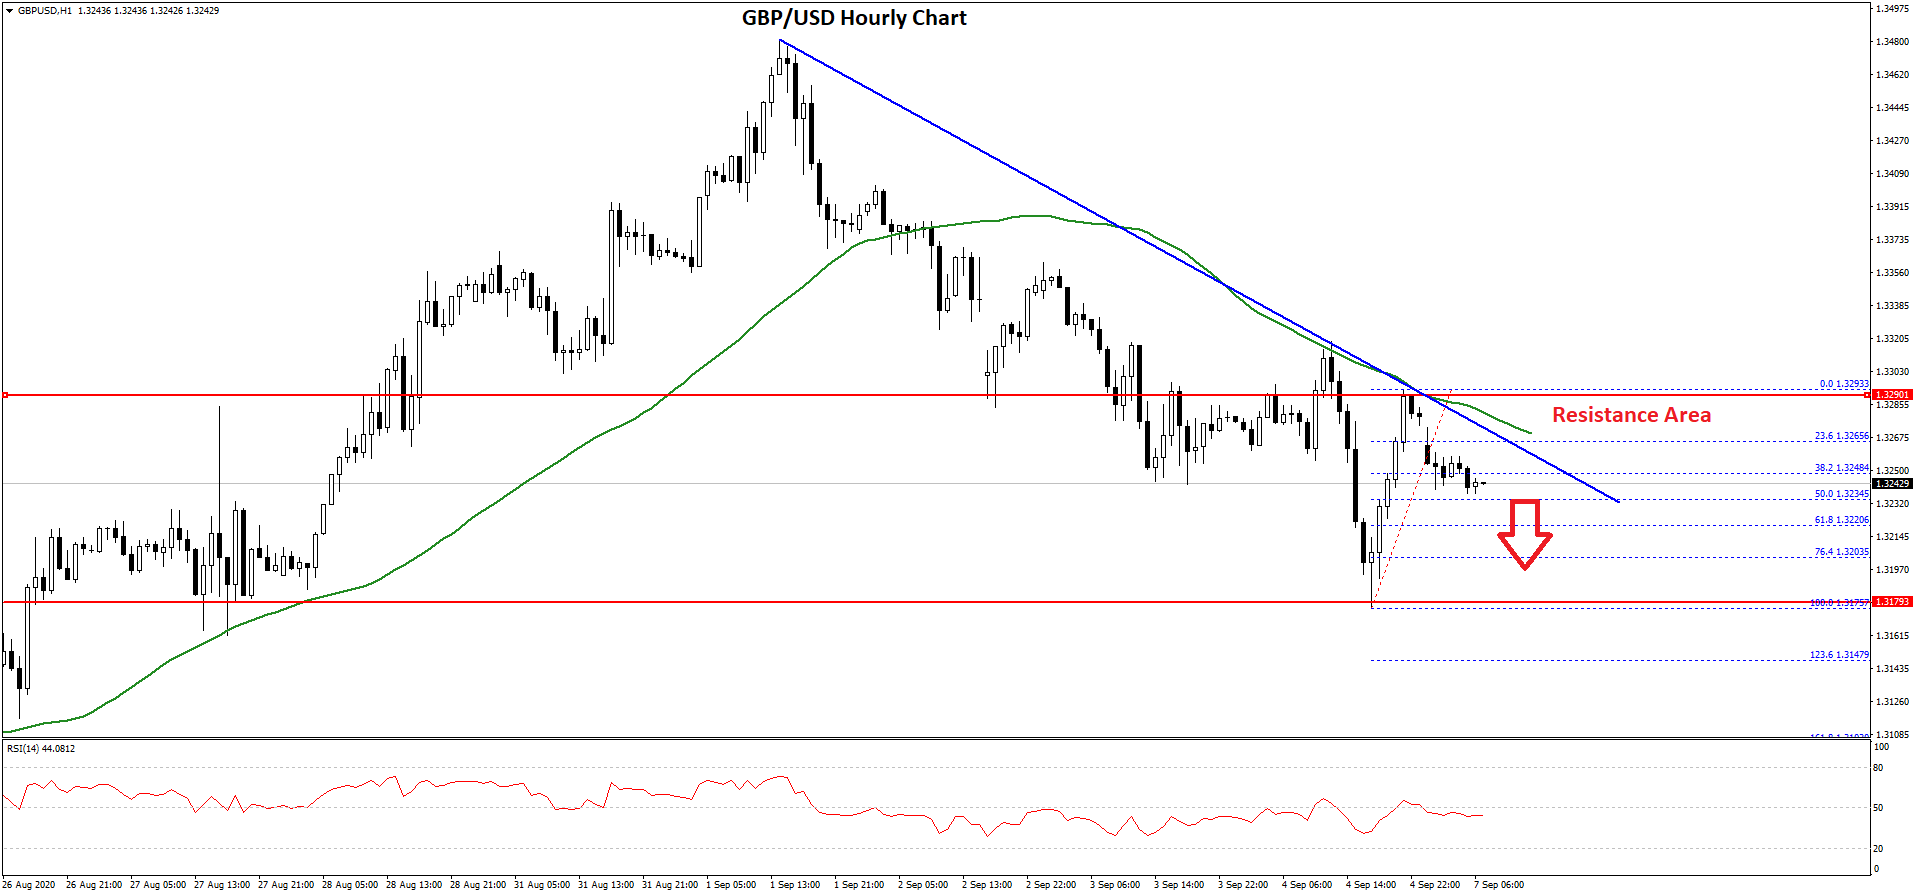
Recently, there was an upside correction above the 1.3250 level. However, the pair failed to gain pace above the 1.3300 resistance level and the 50 hourly simple moving average.
There is also a major bearish trend line forming with resistance near 1.3255 on the hourly chart of GBP/USD. The pair is currently declining and trading below the 38.2% Fib retracement level of the recent recovery from the 1.3175 low to 1.3293 high.
An initial support is near the 1.3235 level. It is close to the 50% Fib retracement level of the recent recovery from the 1.3175 low to 1.3293 high.
If there is a downside break below 1.3235 and 1.3220, the pair is likely to continue lower. In the stated case, GBP/USD may even break the 1.3175 support and continue lower. Conversely, the pair might break the trend line resistance and the 50 hourly SMA to start a fresh increase above 1.3260. The next major resistance is near 1.3300, followed by 1.3320.
GBP/JPY Technical Analysis
The British Pound also followed a similar path from well above the 142.50 level against the Japanese Yen. The GBP/JPY pair broke the 141.80 support to move into a short-term bearish zone.
There was also a break below the 141.50 support and the pair settled below the 50 hourly simple moving average. The pair traded close to the 140.00 level and a low is formed near 140.11.
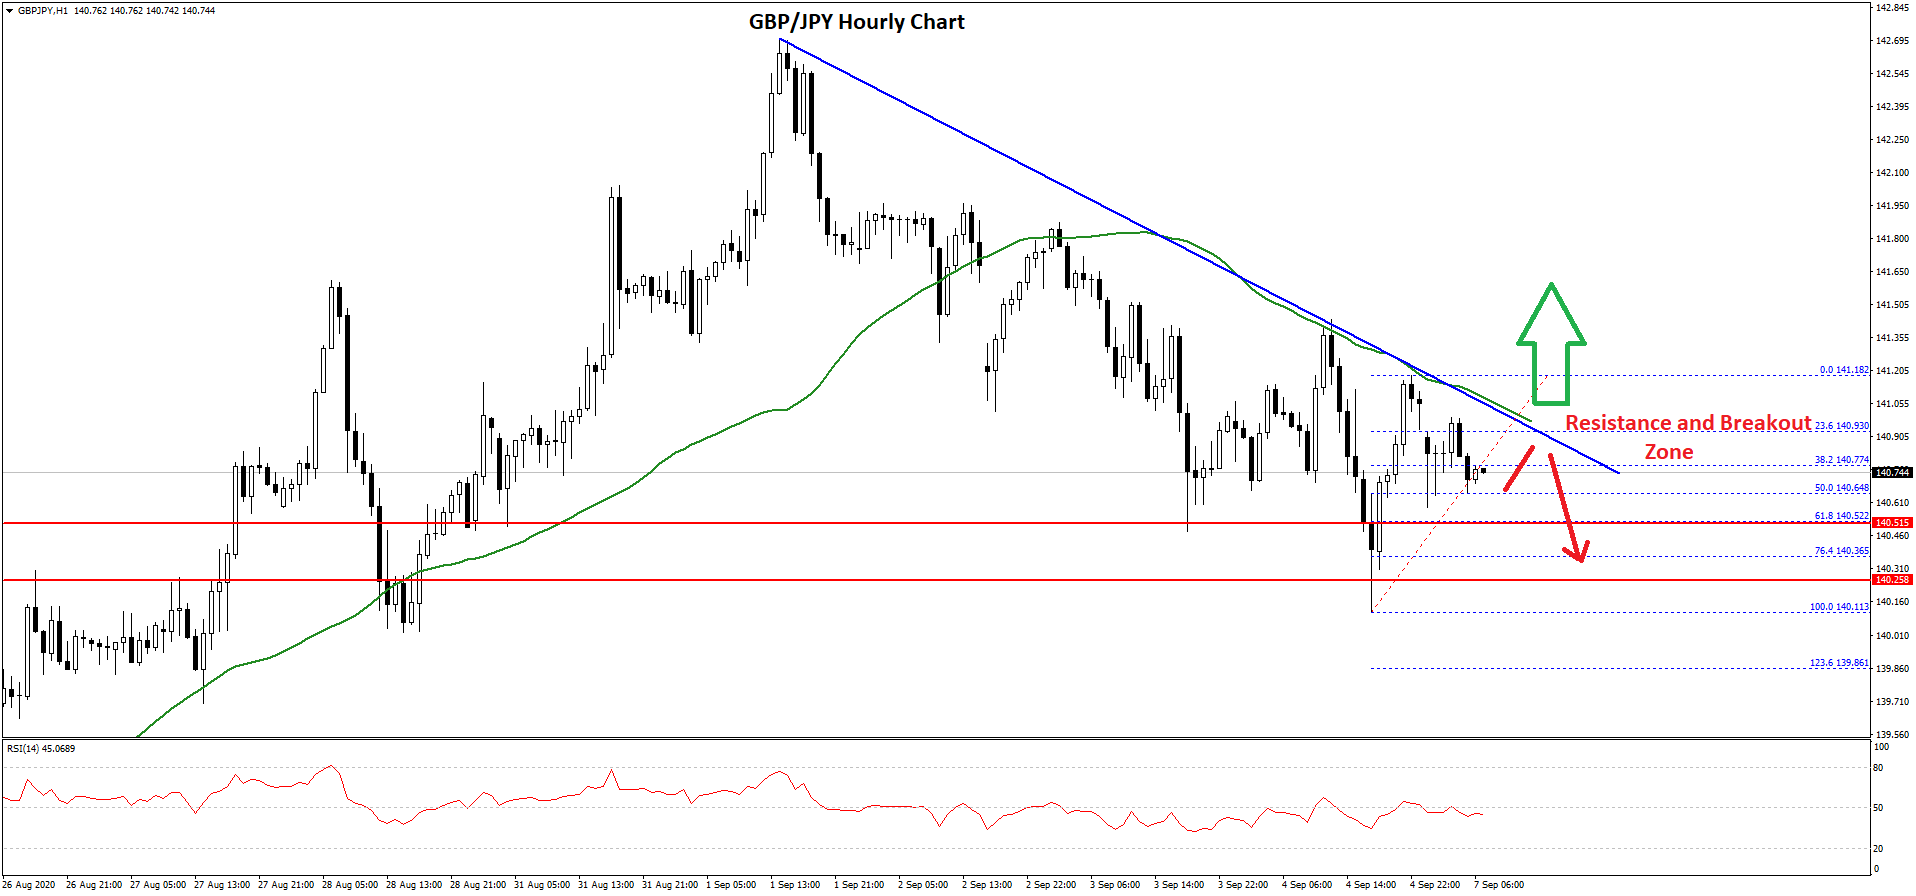
Recently, the pair corrected higher and broke the 140.50 level. However, the upward move was capped by the 141.20 resistance and the 50 hourly simple moving average. A high is formed near 141.18 and the pair is currently declining.
It traded below the 23.6% Fib retracement level of the recent recovery from the 140.11 low to 141.18 high. There is also a key bearish trend line forming with resistance near 140.95 on the hourly chart.
An initial support is near the 140.65 level since it is close to the 50% Fib retracement level of the recent recovery from the 140.11 low to 141.18 high. The next major support is near the 140.50 level, below which the pair might accelerate lower below the 140.20 support zone.
If there is an upside break above the trend line resistance and the 50 hourly SMA, the pair could test 141.40. The next key resistance for the bulls might be near the 142.00 zone.
Trade over 50 forex markets 24 hours a day with FXOpen. Take advantage of low commissions, deep liquidity, and spreads from 0.0 pips. Open your FXOpen account now or learn more about trading forex with FXOpen.
This article represents the opinion of the Companies operating under the FXOpen brand only. It is not to be construed as an offer, solicitation, or recommendation with respect to products and services provided by the Companies operating under the FXOpen brand, nor is it to be considered financial advice.
Latest from Forex Analysis
Latest articles

Google Share Price Rose Post-market to a New All-time Record
Yesterday, after the close of the main trading session, a report on activities for the 1st quarter of Alphabet Inc. (Google's parent company) was published. The report was strong, exceeding investors' expectations.
→ Quarterly EPS = USD 1.89 (expected = USD 1.

S&P 500 Rebounds after Negative GDP News
Data released yesterday showed US GDP growth slowed to 1.6% in the first quarter of the year. According to ForexFactory: forecast = 2.2%, past value = 2.4%.
Reaction to the news sent the S&P 500 mini stock

GBP/USD And USD/CAD Daily Chart Outlook
GBP/USD is attempting a recovery wave from 1.2300. USD/CAD is consolidating and might aim for a move above the 1.3760 resistance zone.
Important Takeaways for GBP/USD and USD/CAD Analysis Today
· The British Pound started