


FXOpen

GBP/USD started a fresh increase above the 1.3400 resistance zone. GBP/JPY traded as high as 140.70 before starting a major downside correction.
Important Takeaways for GBP/USD and GBP/JPY
- The British Pound climbed higher towards the 1.3540 level before correcting lower.
- There was a break below a connecting bullish trend line with support near 1.3430 on the hourly chart of GBP/USD.
- GBP/JPY traded close to the 141.80 resistance level before starting a downside correction.
- There was a break below a major contracting triangle with support near 139.70 on the hourly chart.
GBP/USD Technical Analysis
This past week, the British Pound saw a decent increase above the 1.3400 resistance area against the US Dollar. The GBP/USD pair even broke the 1.3480 resistance to move further into a positive zone.
Finally, there was a break above the 1.3500 level and the pair traded as high as 1.3539 on FXOpen. Recently, the pair started a downside correction and traded below the 1.3500 level. There was a break below the 1.3480 and 1.3450 support levels.
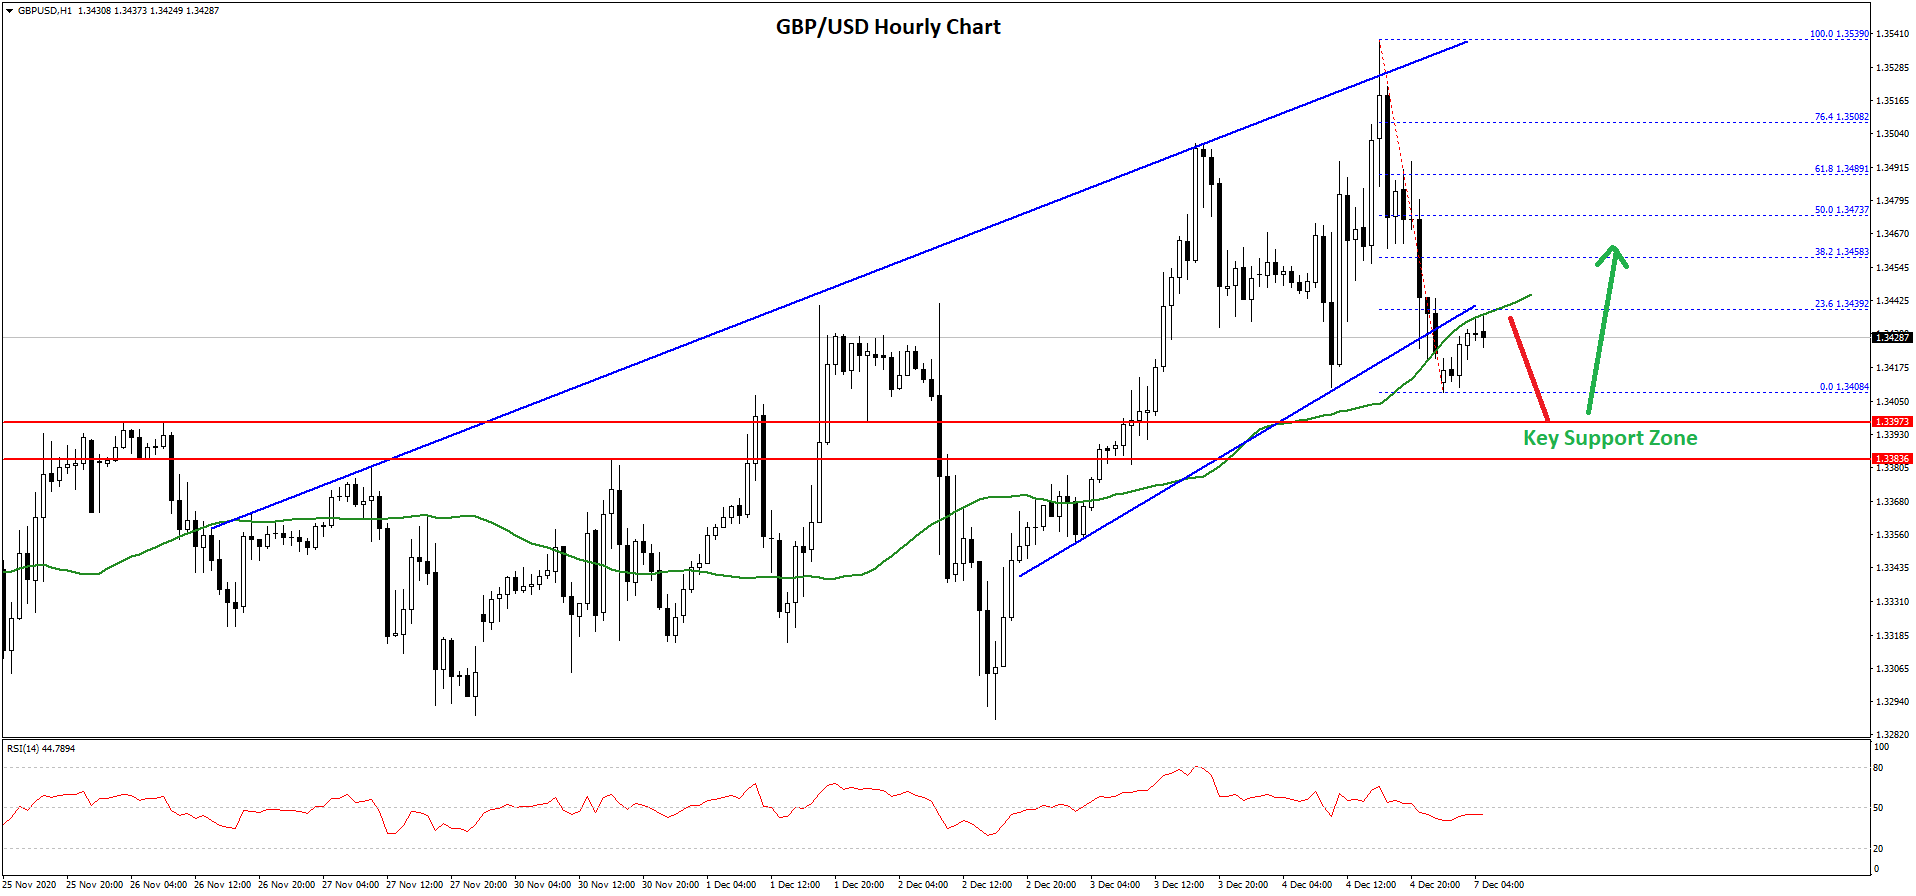
There was also a break below a connecting bullish trend line with support near 1.3430 on the hourly chart of GBP/USD. The pair traded close to the 1.3400 level and it is currently correcting higher.
It is facing resistance near the broken trend line, 1.3440, and the 50 hourly simple moving average. The 23.6% Fib retracement level of the recent decline from the 1.3539 high to 1.3408 low is also near the 1.3440 area.
If there is an upside break above the 1.3440 level and the 50 hourly simple moving average, the pair could start a fresh increase. The next major resistance is near the 1.3475 level.
The 50% Fib retracement level of the recent decline from the 1.3539 high to 1.3408 low is also near the 1.3473 level. Any more upsides could lead the pair above 1.3500. Conversely, the pair could decline further below 1.3408.
The next major support is near the 1.3400 and 1.3385 levels. A close below the 1.3385 level might call for a larger decline towards the 1.3320 level in the near term.
GBP/JPY Technical Analysis
The British Pound also climbed higher above the 140.00 resistance against the Japanese Yen. The GBP/JPY pair even climbed above the 140.50 level, but it failed to continue higher above 140.75.
A swing high was formed near 140.70 before the pair started a downside correction. There was a steady decline below the 140.50 and 140.20 levels. The pair even broke the 50% Fib retracement level of the upward move from the 139.47 swing low to 140.70 high.
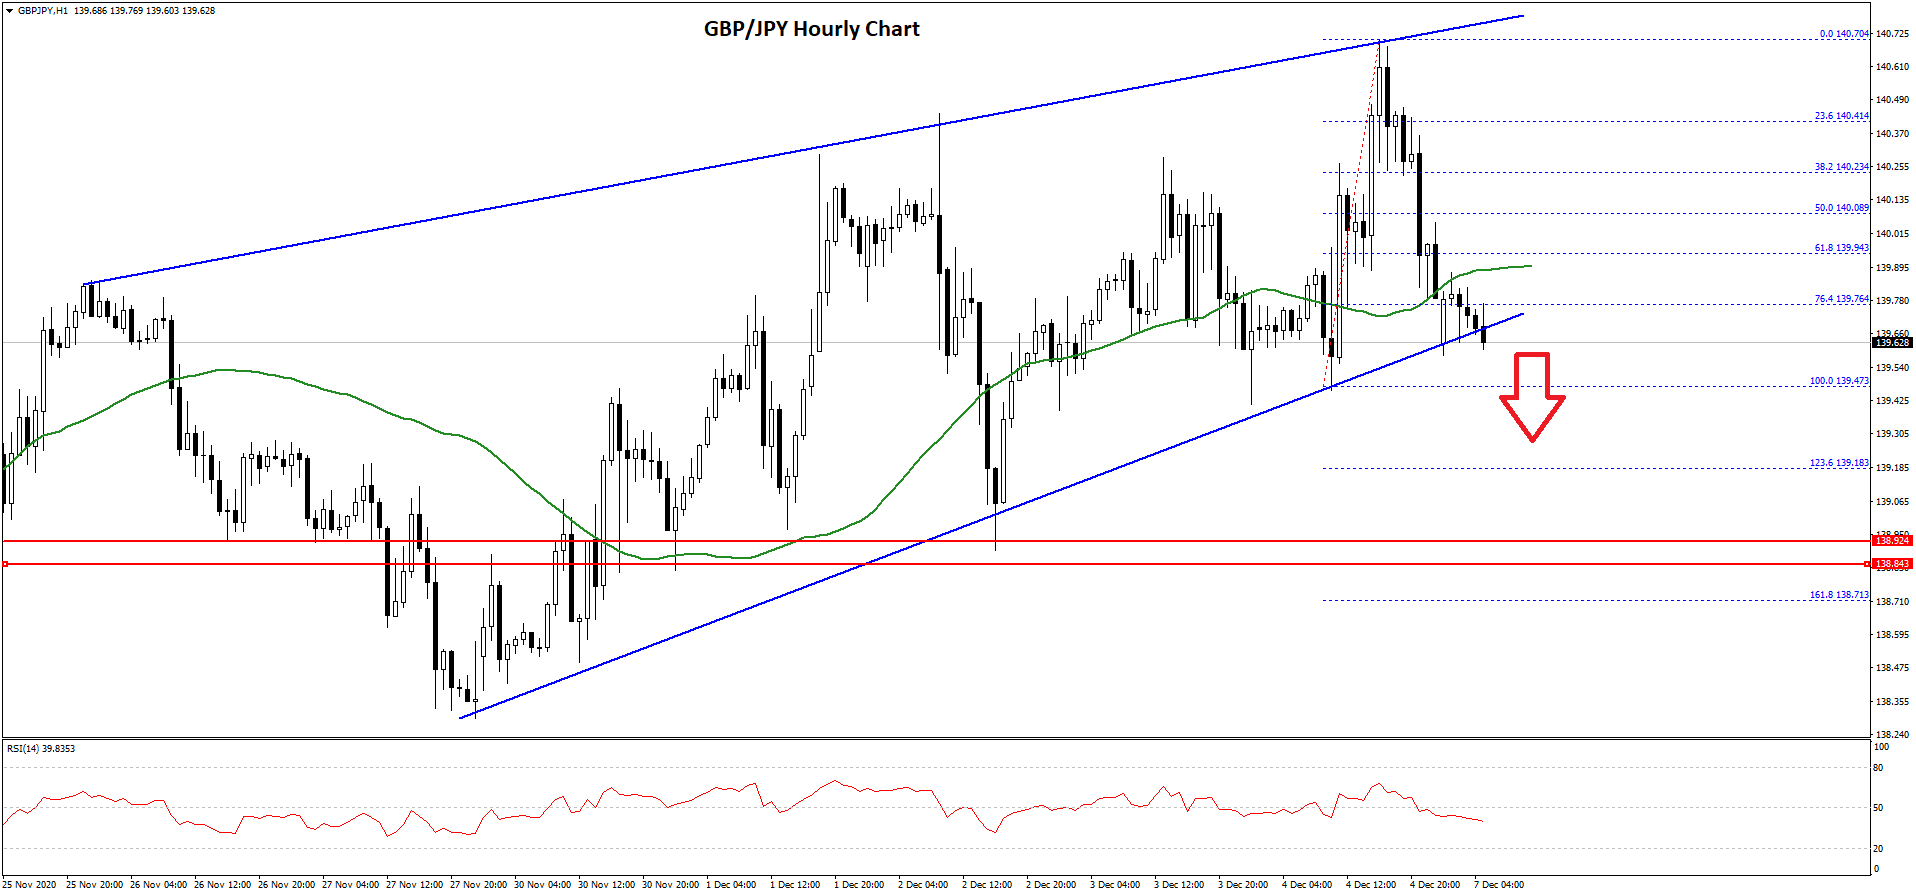
There was also a break below a major contracting triangle with support near 139.70 on the hourly chart. The pair is now trading below the 139.80 level and the 50 hourly simple moving average.
It is now approaching the 139.47 swing low. The next major support is near the 139.20 level. It is close to the 1.236 Fib extension level of the upward move from the 139.47 swing low to 140.70 high. Any more losses could lead the pair towards the 139.00 support zone.
On the upside, the recent breakdown zone near the 140.00 level and the 50 hourly simple moving average might act as a hurdle. The next major resistance is near the 140.25 level, above which the pair could revisit the 140.70 high.
Trade over 50 forex markets 24 hours a day with FXOpen. Take advantage of low commissions, deep liquidity, and spreads from 0.0 pips. Open your FXOpen account now or learn more about trading forex with FXOpen.
This article represents the opinion of the Companies operating under the FXOpen brand only. It is not to be construed as an offer, solicitation, or recommendation with respect to products and services provided by the Companies operating under the FXOpen brand, nor is it to be considered financial advice.
Latest from Forex Analysis
Latest articles

What Order Imbalance Is and How To Use It in a Trading Strategy
Understanding the nuances of order imbalances is key for traders looking to navigate the ebb and flow of asset prices. Order imbalances provide a clear window into the supply and demand dynamics at play, offering strategic insights. This article delves

XAU/USD Gold Price Reaches an Important Resistance Zone
The XAU/USD gold chart today indicates that the historical record price of the metal is above USD 2,400 per ounce.
In addition to fears of a new round of inflation due to rising commodity prices, geopolitical tensions are

What Is a Break of Structure and How Can You Trade It?
In the ever-evolving world of Smart Money Concept (SMC) trading, a nuanced understanding of market dynamics is indispensable. This article explores the concept of Break of Structure (BOS), how to identify it, and its implications for trading strategies, setting traders