


FXOpen
GBP/USD found sellers near 1.3040 after a strong rally this past week. NZD/USD declined heavily and broke the 0.6620 support area. Both pairs could trade higher, but upsides could be capped.
Important Takeaways for GBP/USD and NZD/USD
- The British Pound opened this week with a gap down to 1.2915.
- GBP/USD could test an important bullish trend line with support at 1.2890 on the hourly chart.
- NZD/USD broke the key support at 0.6620 and moved into a bearish zone.
- The Caixin China Manufacturing PMI in August 2018 declined from 50.8 to 50.6.
GBP/USD Technical Analysis
This past week, there was a solid rally in the British Pound from the 1.2800 support area against the US Dollar. The GBP/USD pair traded above the 1.2880 and 1.2950 resistance levels to move into a bullish zone.
The pair also broke the 1.3000 level and traded as high as 1.3043. Later, buyers failed to hold gains above the 1.3020 level, resulting in a push below the 1.3000 handle and the 50 hourly simple moving average.
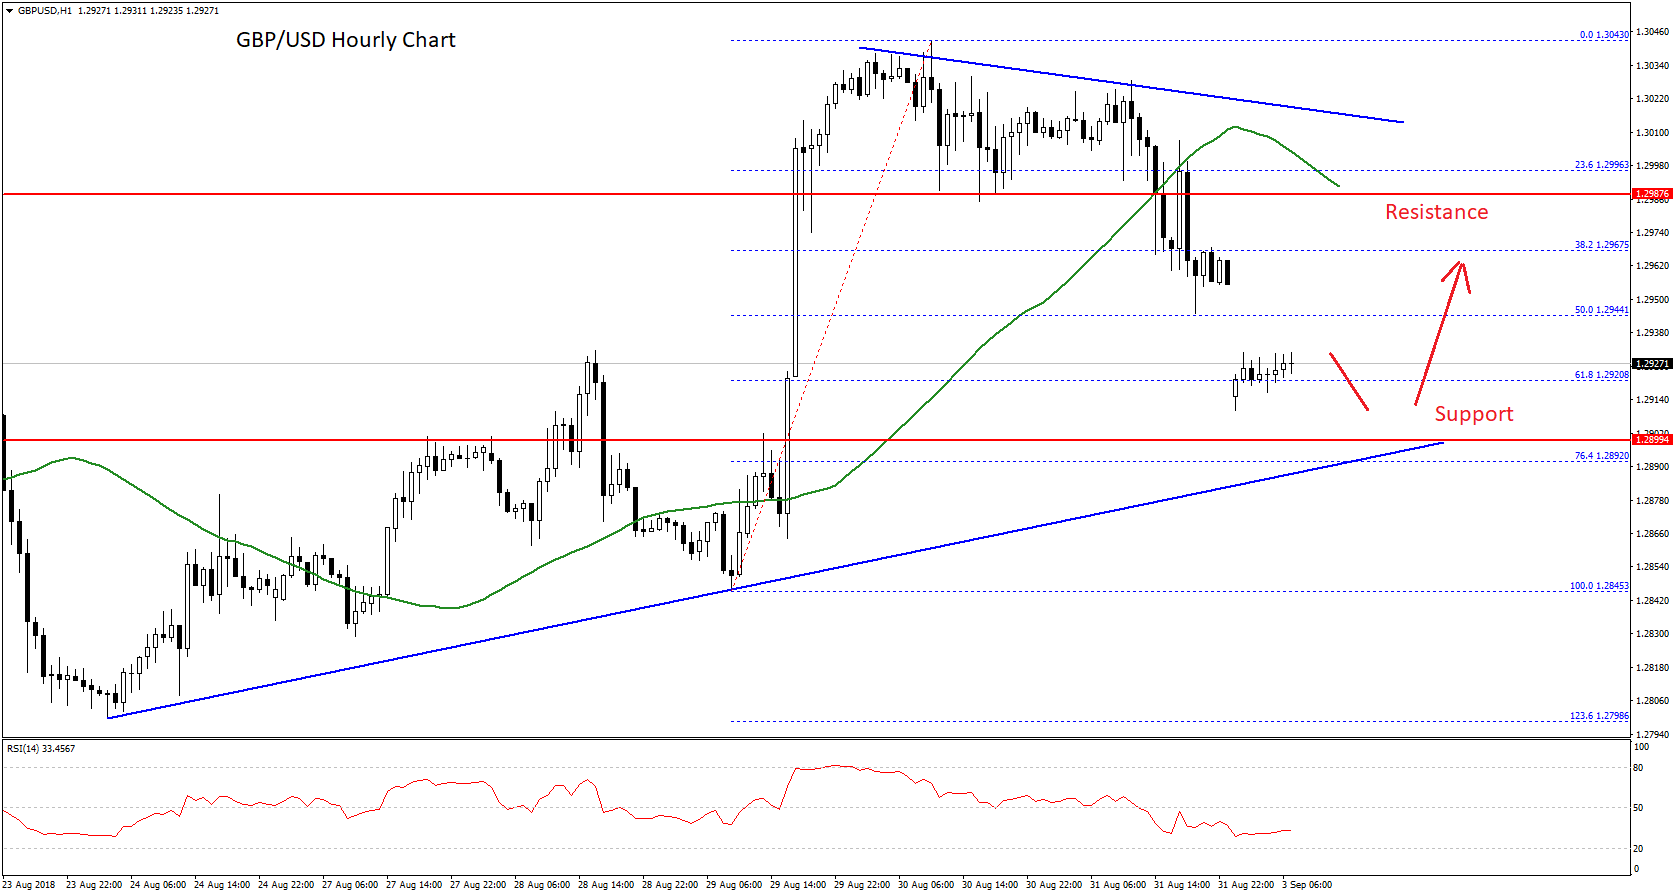
Moreover, there was a break below the 50% Fib retracement level of the last wave from the 1.2845 low to 1.3043 high. More importantly, the pair opened with a gap down this week and traded as low as 1.2910.
At the moment, the pair is consolidating losses near the 61.8% Fib retracement level of the last wave from the 1.2845 low to 1.3043 high. On the downside, there is an important bullish trend line with support at 1.2890 on the hourly chart.
There could be a minor downside in GBP/USD towards the trend line support and 1.2900. Later, the pair is likely to correct higher towards the 1.2950 and 1.2960 levels. However, upsides are likely to be capped near the 1.2980 level and the 50 hourly SMA.
It seems like there is a strong resistance forming near 1.3000, a bearish trend line on the hourly chart, and the 50 hourly SMA. As long as the pair is below these, it remains sell on rallies towards the 1.2960 and 1.2980 levels.
NZD/USD Technical Analysis
The New Zealand Dollar remained in a downtrend this past week after it failed to break the 0.6720 resistance area against the US Dollar. The NZD/USD pair declined and broke the 0.6650 and 0.6620 support levels.
The decline was such that the pair even broke the 0.6600 support and settled below the 50 hourly simple moving average. The pair also cleared a declining channel with support at 0.6626 on the hourly chart and traded as low as 0.6593.
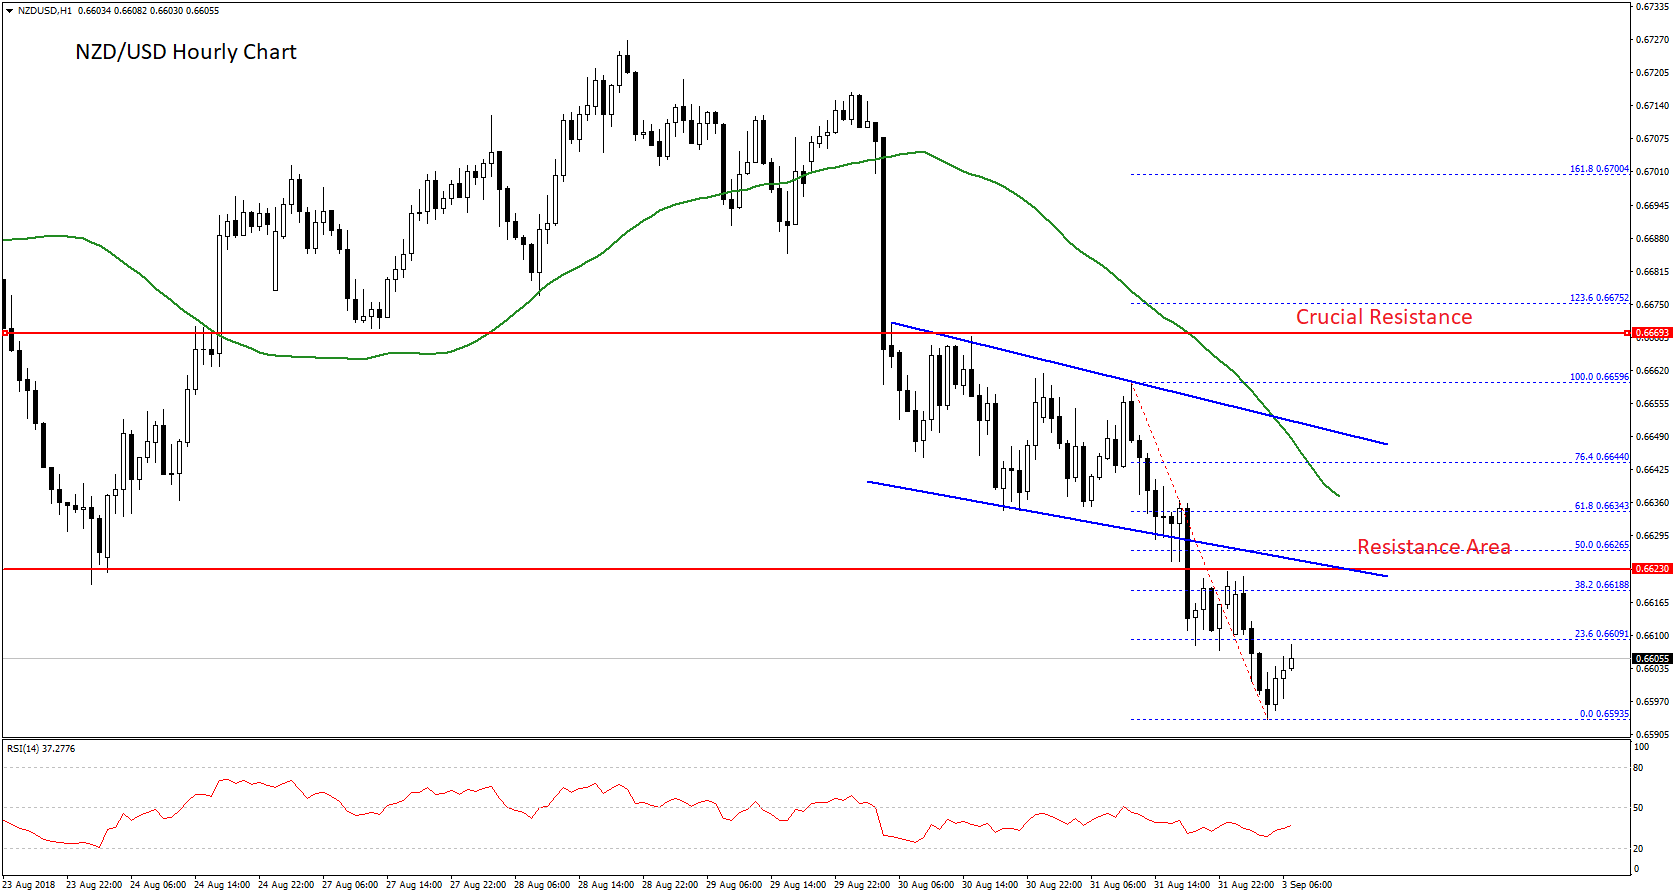
At the moment, the pair is correcting higher and is testing the 23.6% Fib retracement level of the last decline from the 0.6659 high to 0.6593 low. On the upside, there is a strong resistance forming near the 0.6620-0.6625 zone. It represents the previous support zone and now coincides with the broken trend line at 0.6625.
Moreover, the 50% Fib retracement level of the last decline from the 0.6659 high to 0.6593 low is at 0.6626. Above 0.6625, the next resistance is near the 0.6635 level and the 50 hourly SMA.
Therefore, if the pair corrects higher, it could face a strong resistance near the 0.6625 and 0.6635 levels. On the downside, a break below the 0.6593 low could open the doors for a push towards the 0.6580 and 0.6575 levels.
Trade over 50 forex markets 24 hours a day with FXOpen. Take advantage of low commissions, deep liquidity, and spreads from 0.0 pips. Open your FXOpen account now or learn more about trading forex with FXOpen.
This article represents the opinion of the Companies operating under the FXOpen brand only. It is not to be construed as an offer, solicitation, or recommendation with respect to products and services provided by the Companies operating under the FXOpen brand, nor is it to be considered financial advice.
Latest from Forex Analysis
Latest articles

Weekly Market Wrap With Gary Thomson: UK100, USD, GOLD, OIL
Get the latest scoop on the week's hottest headlines, all in one convenient video. Join Gary Thomson, the COO of FXOpen UK, as he breaks down the most significant news reports and shares his expert insights.
- UK100 Share Index Rises

What Is a Darvas Box Theory and How Does It Work in Trading?
The Darvas Box Theory, pioneered by Nicolas Darvas in the 1950s, has transcended its stock market origins to become a valuable tool for forex traders. This method leverages specific price movements and patterns, known as the Darvas Box, to track

NFLX Stock Price Falls Despite Subscriber Growth
Yesterday, after the close of the main trading session on the stock market, Netflix reported to investors for the 1st quarter of 2024.
The report turned out better than expected:
→ earnings per share: actual = USD 5.28, forecast = USD 4.