


FXOpen

GBP/USD is holding the 1.2900 support area and it could continue higher. USD/CAD is also climbing higher, but it might struggle to clear the 1.2950 resistance area.
Important Takeaways for GBP/USD and USD/CAD
- The British Pound is showing positive signs above the 1.2880 and 1.2900 support levels.
- There is a major bearish trend line forming with resistance near 1.2942 on the hourly chart of GBP/USD.
- USD/CAD is holding the main 1.3250 and 1.3260 support levels, with positive signs.
- There is a crucial bearish trend line forming with resistance near 1.3305 on the hourly chart.
GBP/USD Technical Analysis
This past week, the British Pound declined below the 1.2900 support area against the US Dollar. However, the 1.2830 area acted as a strong buy zone and GBP/USD climbed back above 1.2900.
The pair gained pace above the 1.2900 resistance and the 50 hourly simple moving average. Finally, the pair climbed above the 1.2920 resistance level, traded close to the 1.2960 resistance area.
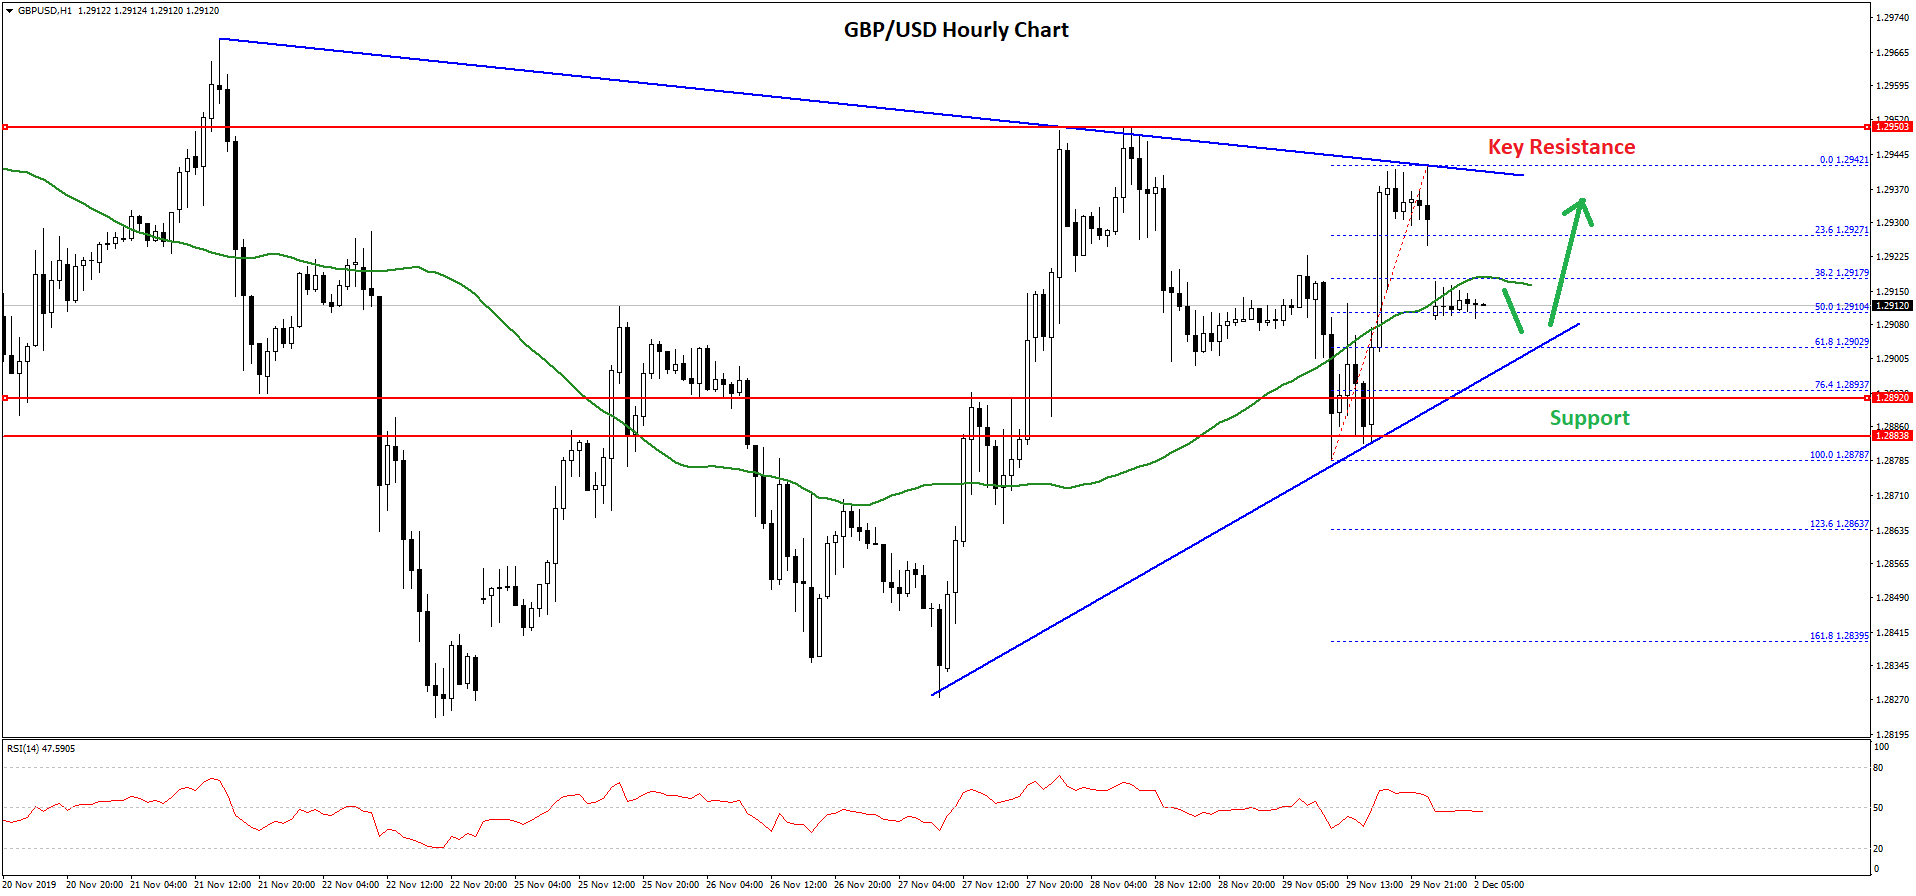
A high was formed near the 1.2950 level on FXOpen before the pair corrected lower. It declined below 1.2920 and tested the 1.2900 support area. The last swing low was near 1.2878 and the last swing high was near 1.2942.
The pair is currently trading near the 50 hourly simple moving average and above the 50% Fib retracement level of the last wave from the 1.2878 low to 1.2942 high.
On the upside, there is a strong resistance forming near the 1.2950 area. Moreover, there is a major bearish trend line forming with resistance near 1.2942 on the hourly chart of GBP/USD.
Therefore, the pair must climb above the 1.2940 and 1.2950 resistance levels to continue higher. In the mentioned case, the pair is likely to test the main 1.3000 resistance area.
Conversely, if there are more losses, the pair might test the 1.2900 support area. Any further losses may perhaps push the pair towards the 1.2880 and 1.2850 support levels.
USD/CAD Technical Analysis
The US Dollar remained well bid above the 1.3250 and 1.3260 support levels against the Canadian Dollar. However, the USD/CAD pair failed to continue above 1.3300 and 1.3310 resistance levels.
The last swing high was formed near 1.3313 before the pair declined and revisited the 1.3260 support area. A low was formed near 1.3267 and the pair is currently correcting higher.
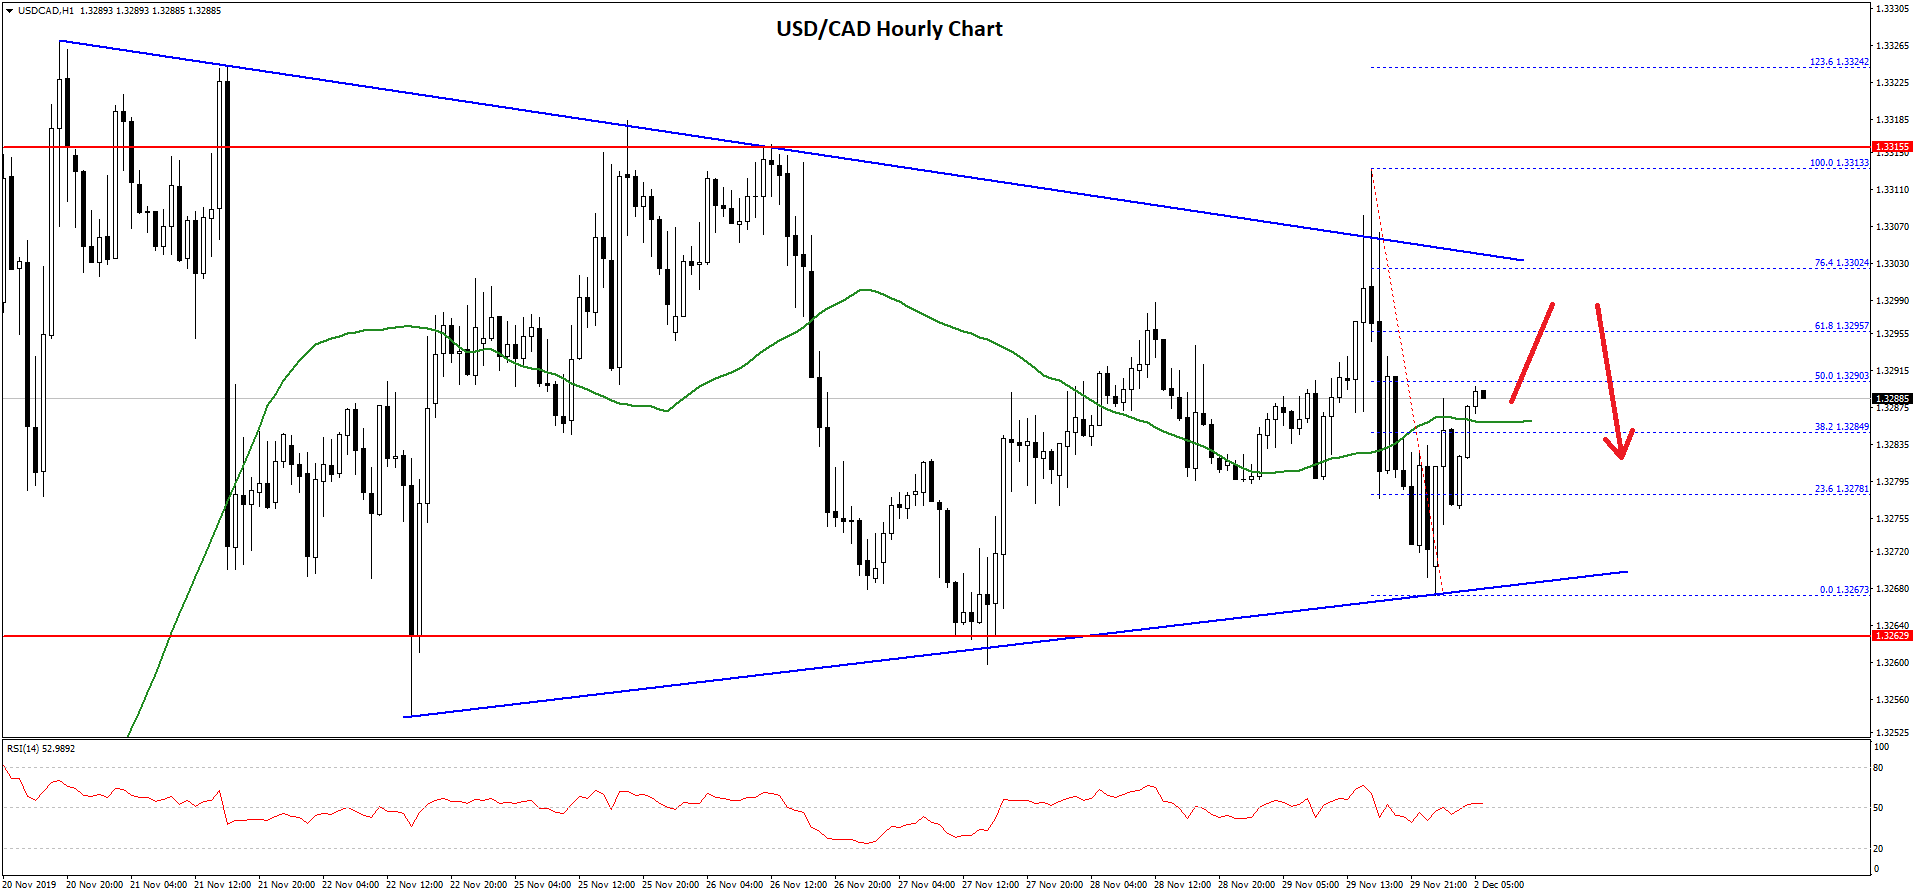
It is trading above the 1.3280 level and the 50 hourly simple moving average. Besides, it is testing the 50% Fib retracement level of the last decline from the 1.3313 high to 1.3267 low.
On the upside, there are many resistances near the 1.3295 and 1.3300 levels. Additionally, there is a crucial bearish trend line forming with resistance near 1.3305 on the hourly chart.
Therefore, the bulls need to gain strength above 1.3300 and 1.3310 resistance levels to push the pair further higher. The next key resistance is near the 1.3340 level, above which the pair could test the 1.3385 level.
On the downside, the pair remains well supported near the 1.3260 and 1.3250 levels. If USD/CAD settles below the 1.3250 support, there is a risk of an extended decline towards the 1.3220 level. The main support is near the 1.3200 area, where the bulls are likely to appear.
Trade over 50 forex markets 24 hours a day with FXOpen. Take advantage of low commissions, deep liquidity, and spreads from 0.0 pips. Open your FXOpen account now or learn more about trading forex with FXOpen.
This article represents the opinion of the Companies operating under the FXOpen brand only. It is not to be construed as an offer, solicitation, or recommendation with respect to products and services provided by the Companies operating under the FXOpen brand, nor is it to be considered financial advice.
Latest from Forex Analysis
Latest articles

Since the Start of the Week, Brent Oil Price Has Dropped over 4%
At the beginning of the week, March 15, we wrote that the price of Brent oil could form a correction from the resistance level of USD 91 per barrel. Since then, the price has decreased by more than 4% due

Fair Value Gaps vs Liquidity Voids in Trading
Understanding fair value gaps and liquidity voids is essential for traders seeking to navigate the complexities of the financial markets. These concepts, deeply rooted in the Smart Money Concept (SMC), provide valuable insights into the dynamics of supply and demand,

UK100 Share Index Rises as UK Inflation Slows
Yesterday, the UK Office for National Statistics (ONS) reported that the CPI stood at 3.2% in March. According to ForexFactory, analysts expected 3.1%, and a month ago the index was 3.4%.
Grant Fitzner, chief economist at the