


FXOpen
GBP/USD declined recently below the 1.3080 and 1.3050 support levels. USD/CAD tested the 1.3380 level and recently started a fresh increase above the 1.3410 level.
Important Takeaways for GBP/USD and USD/CAD
- The British Pound declined heavily and even spiked below the 1.3000 support area.
- There is a major bearish trend line forming with resistance near 1.3025 on the hourly chart of GBP/USD.
- USD/CAD started a decent upward move after it declined towards the 1.3380 level.
- The pair is currently struggling near the previous bullish trend line at 1.3440 on the hourly chart.
GBP/USD Technical Analysis
The British Pound started a fresh decline after it failed to break the 1.3180 resistance area against the US Dollar. The GBP/USD pair traded below the 1.3120 and 1.3080 support levels to move into a bearish zone.
The pair even broke the 1.3050 support level and the 50 hourly simple moving average. Finally, there was a spike below the 1.3000 support area and the pair traded as low as 1.2967 on FXOpen.
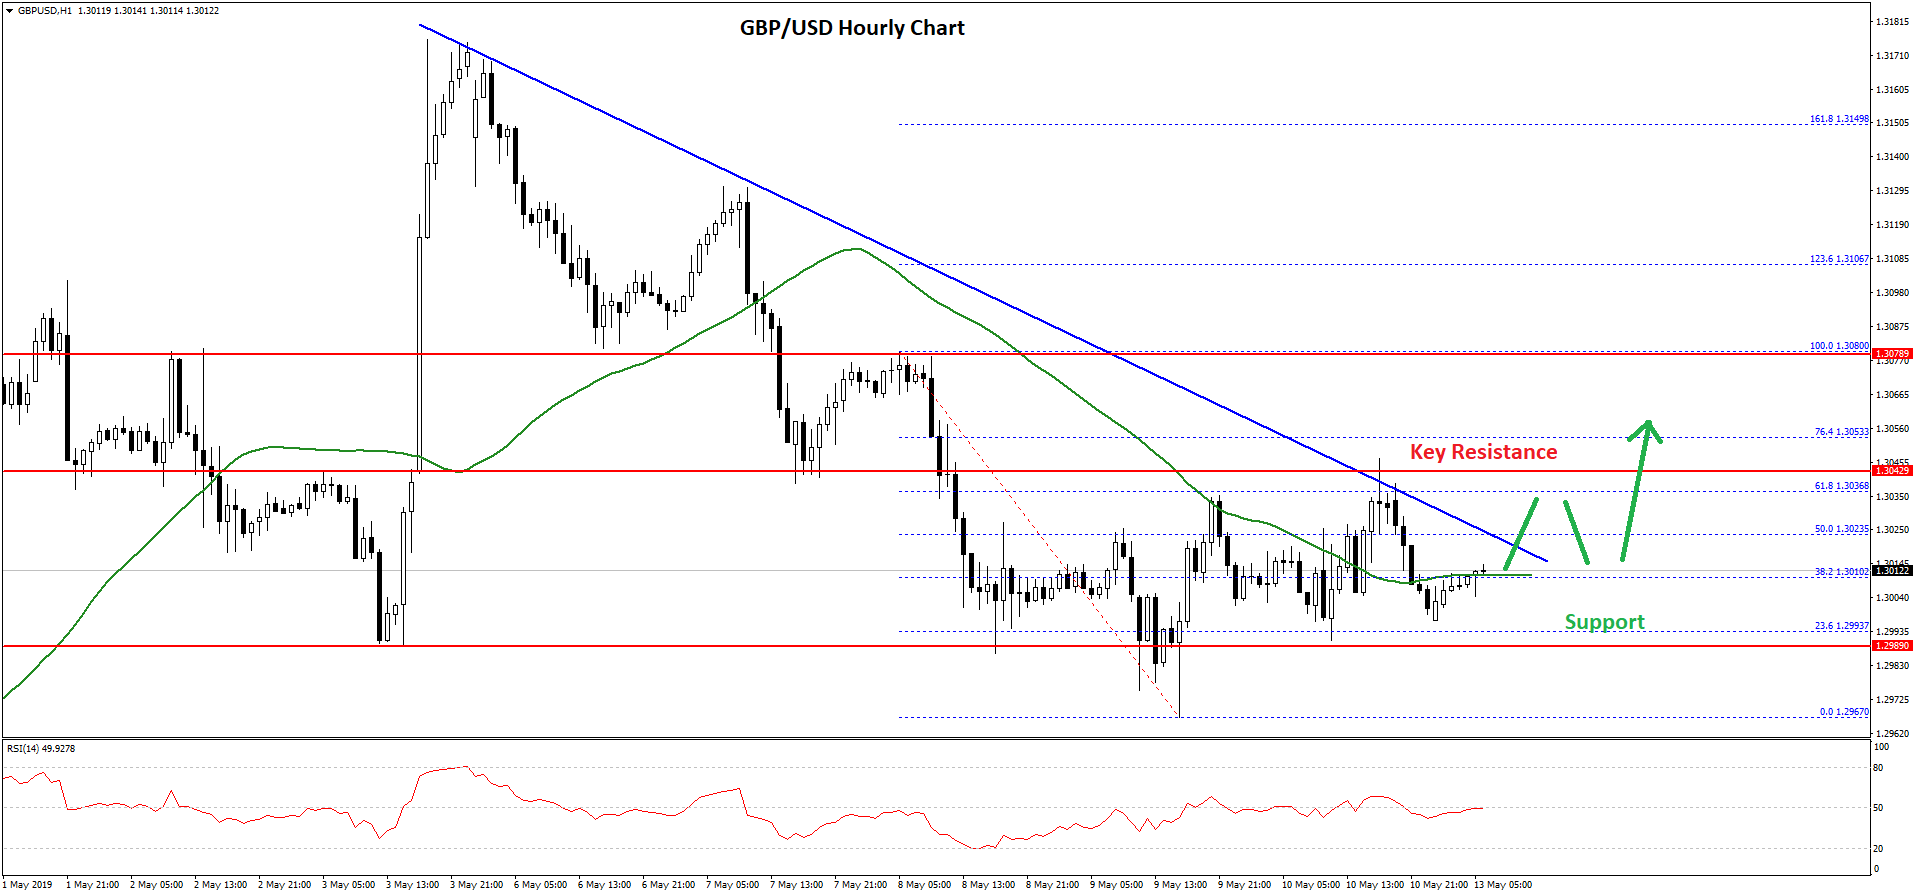
Recently, the pair started a decent recovery and traded above the 1.3000 resistance. There was a break above the 1.3020 level, 50 hourly simple moving average, and the 50% Fib retracement level of the last decline from the 1.3088 high to 1.2967 low.
However, the upward move was capped by the 1.3045 level and the 61.8% Fib retracement level of the last decline from the 1.3088 high to 1.2967 low.
There is also a major bearish trend line forming with resistance near 1.3025 on the hourly chart of GBP/USD. In the short term, there could be swing moves, but the pair is likely to break the 1.3020 and 1.3025 resistance levels.
The main resistance is near the 1.3080 level, where sellers are likely to appear and protect additional gains. On the downside, an immediate support is at 1.3000, followed by the 1.2985 level.
If GBP/USD fails to move above the 1.3025 resistance, there is a risk of a fresh decrease below the 1.2980 and 1.2960 levels in the near term.
USD/CAD Technical Analysis
The US Dollar failed on multiple occasions near the 1.3490 and 1.3500 resistance levels against the Canadian Dollar. As a result, the USD/CAD pair declined heavily and broke the 1.3450 and 1.3400 support levels.
The pair settled below the 50 hourly simple moving average and even spiked below the 1.3400 level. A swing low was formed at 1.3380 before the pair recovered nicely.
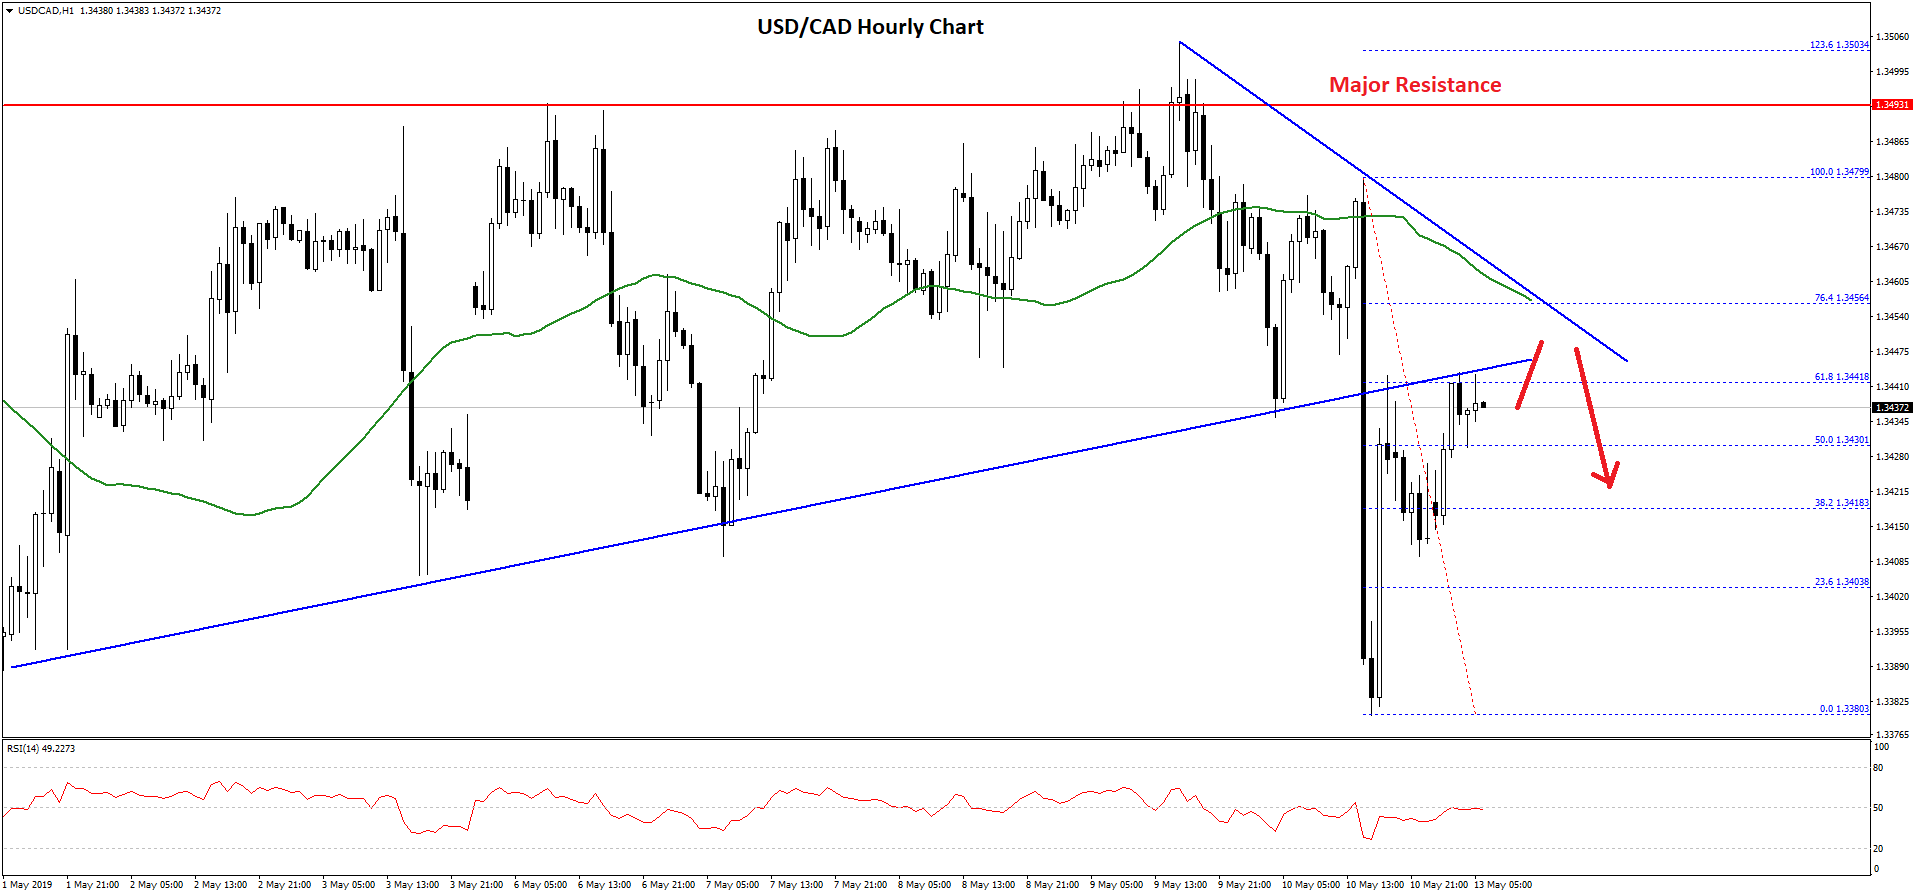
It broke the 1.3420 level and the 50% Fib retracement level of the last decline from the 1.3479 high to 1.3380 low. However, the pair is currently facing a strong resistance near the 1.3440 level and a previous connecting bullish trend line on the hourly chart.
Above 1.3440, there is a connecting bearish trend line at 1.3455 and the 50 hourly simple moving average. Therefore, there are many hurdles for USD/CAD buyers near 1.3440 and 1.3455 levels.
The 61.8% Fib retracement level of the last decline from the 1.3479 high to 1.3380 low is also acting as a resistance.
Overall, as long as the pair is below the 1.3455 level and the 50 hourly SMA, there is a risk of a fresh decline towards the 1.3400 support level in the near term.
Trade over 50 forex markets 24 hours a day with FXOpen. Take advantage of low commissions, deep liquidity, and spreads from 0.0 pips. Open your FXOpen account now or learn more about trading forex with FXOpen.
This article represents the opinion of the Companies operating under the FXOpen brand only. It is not to be construed as an offer, solicitation, or recommendation with respect to products and services provided by the Companies operating under the FXOpen brand, nor is it to be considered financial advice.
Latest from Forex Analysis
Latest articles

Anchored VWAP and How You Can Use It in Forex Trading
In the world of forex trading, understanding the nuanced tools at your disposal can significantly enhance decision-making processes. One such sophisticated tool is the Anchored Volume-Weighted Average Price (Anchored VWAP), which refines the standard VWAP by allowing traders to set

META Share Price Collapses after Publication of Quarterly Report
Just yesterday, META's stock price closed at USD 493.50, up approximately 40% since the start of 2024 and up nearly 300% since the start of 2023.
However, following the release of Meta's quarterly report, its shares plummeted to USD

USD/JPY Analysis: The Rate Exceeds The Level of 155 Yen Per US Dollar
Today, the price of USD/JPY once again renewed its 34-year high, exceeding the level of 155 yen per dollar, which put pressure on the current authorities.
According to Reuters, officials are trying to maintain calm in the market.
"We