


FXOpen

GBP/USD started a major decline after it failed to surpass the 1.2750 resistance area. USD/CAD is also trading in a bearish zone and it could struggled to climb above 1.3120.
Important Takeaways for GBP/USD and USD/CAD
- The British Pound remained in a bearish zone after it settled below the 1.2640 support.
- There is a major bearish trend line forming with resistance near 1.2560 on the hourly chart of GBP/USD.
- USD/CAD struggled to continue higher and recently declined below the 1.3120 support.
- The pair recently surpassed a connecting bearish trend line with resistance near 1.3065 on the hourly chart.
GBP/USD Technical Analysis
The British Pound failed to extend gains above 1.2740 this past week against the US Dollar. As a result, the GBP/USD pair started a major decline and broke the 1.2680 and 1.2640 support levels to move into a bearish zone.
The recent decline gained pace below the 1.2600 level and the 50 hourly simple moving average. The pair even broke the 1.2500 level and recently traded close to the 1.2480 level on FXOpen.
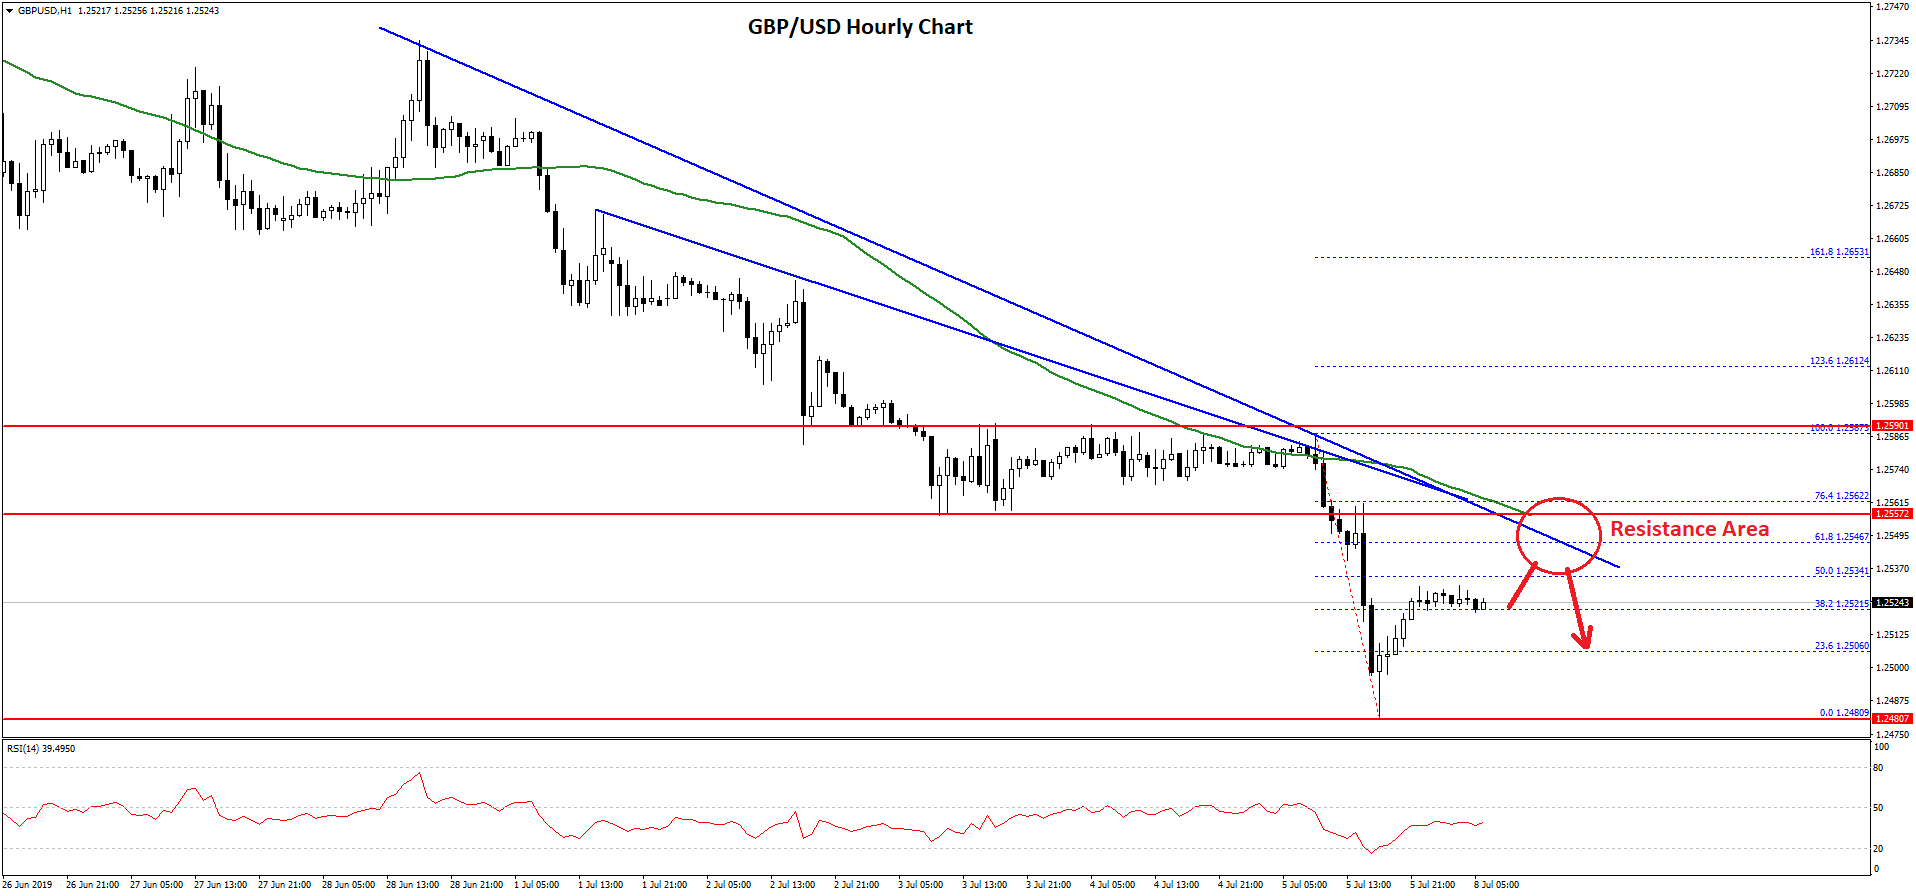
A swing low was formed near 1.2480 and the pair is currently correcting higher. It traded above the 1.2500 level and the 23.6% Fib retracement level of the last decline from the 1.2587 high to 1.2480 low.
However, there are many resistances on the upside near 1.2540 and 1.2550 levels. Moreover, there is a major bearish trend line forming with resistance near 1.2560 on the hourly chart of GBP/USD.
The 50% Fib retracement level of the last decline from the 1.2587 high to 1.2480 low is also near 1.2534 to act as a resistance. However, the main resistance is near the 1.2580 level and the 50 hourly simple moving average.
To start a fresh increase, the pair must settle above the 1.2580 resistance and the 50 hourly simple moving average. On the downside, an initial support is near the 1.2500 level, below which the pair could once again test the 1.2480 level.
USD/CAD Technical Analysis
The US Dollar made another attempt to climb above the 1.3140 and 1.3150 resistance levels against the Canadian Dollar. The USD/CAD pair topped near the 1.3136 level and recently started a major decline.
During the last rise, the pair surpassed a connecting bearish trend line with resistance near 1.3065 on the hourly chart. However, it failed to hold gains and recently declined from the 1.3136 high.
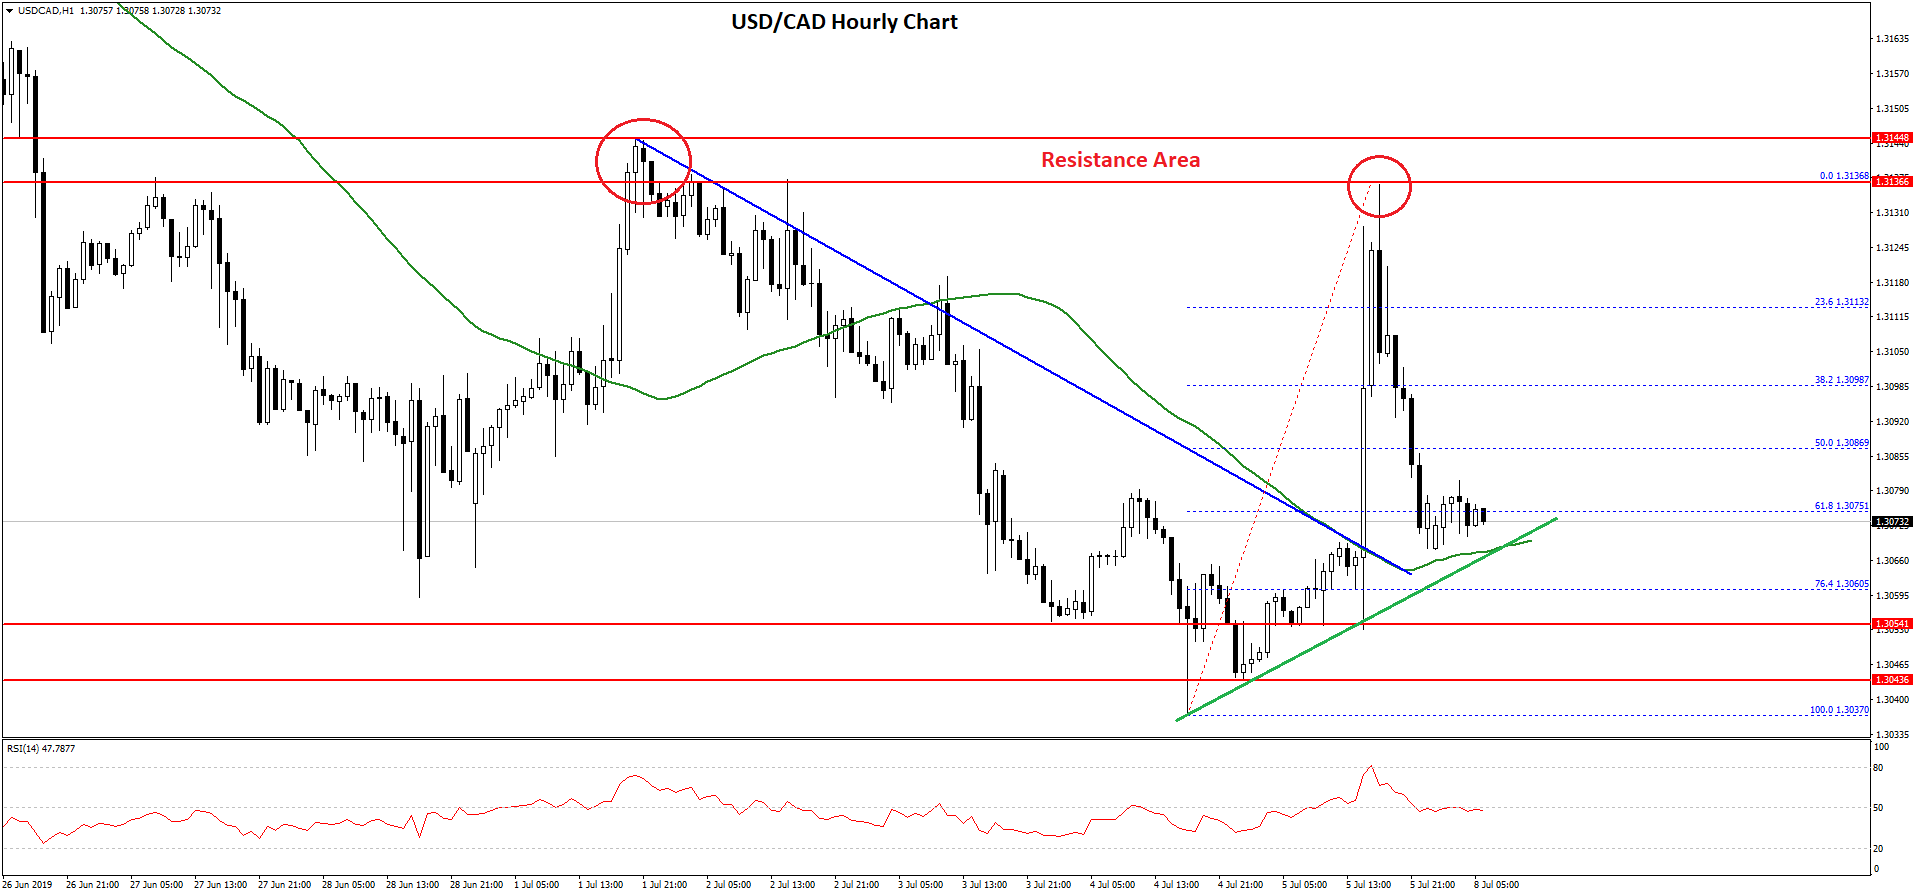
There was a break below the 1.3100 support level and the 50% Fib retracement level of the last wave from the 1.3037 low to 1.3136 high. The recent decline was such that the pair even broke the 1.3080 support area.
At the moment, the pair is consolidating above the 50 hourly simple moving average and just below the 61.8% Fib retracement level of the last wave from the 1.3037 low to 1.3136 high.
If there is a downside break below the 1.3060 support plus the 50 hourly simple moving average, there could be a sharp decline in the near term. The next key support is near the 1.3040 and 1.3020 levels.
On the upside, the main resistances for USD/CAD are near 1.3100 and 1.3120. Should there be a break above the 1.3120 level, the pair could continue to rise in the coming sessions.
Trade over 50 forex markets 24 hours a day with FXOpen. Take advantage of low commissions, deep liquidity, and spreads from 0.0 pips. Open your FXOpen account now or learn more about trading forex with FXOpen.
This article represents the opinion of the Companies operating under the FXOpen brand only. It is not to be construed as an offer, solicitation, or recommendation with respect to products and services provided by the Companies operating under the FXOpen brand, nor is it to be considered financial advice.
Latest from Forex Analysis
Latest articles

Anchored VWAP and How You Can Use It in Forex Trading
In the world of forex trading, understanding the nuanced tools at your disposal can significantly enhance decision-making processes. One such sophisticated tool is the Anchored Volume-Weighted Average Price (Anchored VWAP), which refines the standard VWAP by allowing traders to set

META Share Price Collapses after Publication of Quarterly Report
Just yesterday, META's stock price closed at USD 493.50, up approximately 40% since the start of 2024 and up nearly 300% since the start of 2023.
However, following the release of Meta's quarterly report, its shares plummeted to USD

USD/JPY Analysis: The Rate Exceeds The Level of 155 Yen Per US Dollar
Today, the price of USD/JPY once again renewed its 34-year high, exceeding the level of 155 yen per dollar, which put pressure on the current authorities.
According to Reuters, officials are trying to maintain calm in the market.
"We