


FXOpen
GBP/USD is slowly recovering and it is currently trading above 1.2680. USD/CAD is likely to resume its upward move above the 1.3550 and 1.3580 resistance levels.
Important Takeaways for GBP/USD and USD/CAD
- The British Pound declined close to the 1.2600 area and recently started an upside correction.
- There is a major ascending channel forming with support near 1.2680 on the hourly chart of GBP/USD.
- USD/CAD corrected lower recently and tested the key 1.3430 support area.
- The pair is currently following a bullish flag pattern with resistance near 1.3450 on the hourly chart.
GBP/USD Technical Analysis
The British Pound declined heavily this past week and broke the key 1.2820 support area against the US Dollar. The GBP/USD pair extended losses below the 1.2750 and 1.2700 support levels.
The pair even broke the 1.2650 support level and the 50 hourly simple moving average. It traded close to the 1.2600 support area and formed a swing low at 1.2605 on FXOpen.
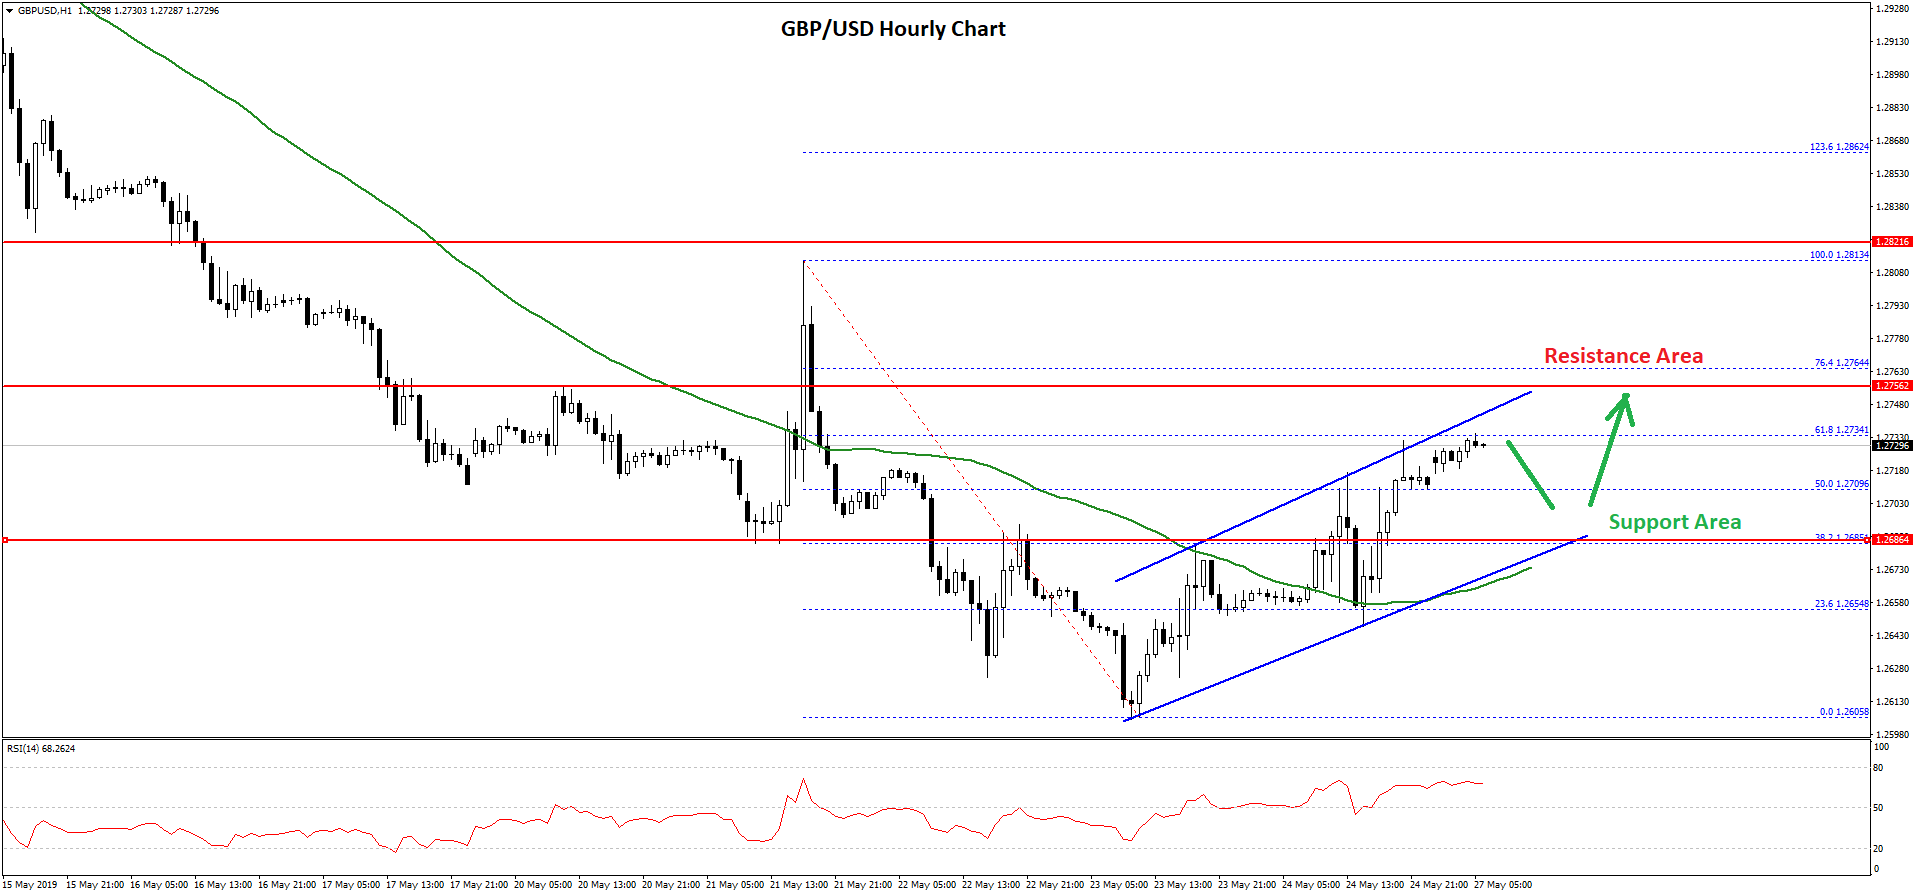
Recently, the pair started a decent recovery and traded above the 1.2650 resistance. The upward move was positive, considering it broke the 1.2700 resistance, the 50 hourly simple moving average, and the 50% Fib retracement level of the last drop from the 1.2813 high to 1.2605 low.
At the moment, there is a major ascending channel forming with support near 1.2680 on the hourly chart of GBP/USD. The pair is currently trading near the channel resistance at 1.2735.
Moreover, it is testing the 61.8% Fib retracement level of the last drop from the 1.2813 high to 1.2605 low. Therefore, the pair could decline or correct lower in the short term below 1.2710.
An initial support on the downside is near the 1.2700 level. However, the main support is near the channel, 1.2680, and the 50 hourly SMA. As long as there is no close below the 1.2680 support area, the pair is likely to bounce back in the near term.
On the upside, an initial resistance is at 1.2735, above which the bulls could target 1.2800 or even 1.2820.
USD/CAD Technical Analysis
The US Dollar remained strong above the 1.3400 level against the Canadian Dollar. The USD/CAD pair climbed towards the 1.3500 level before it started a downside correction.
A swing high was formed at 1.3502 before the pair declined below the 1.3465 level and the 38.2% Fib retracement level of the last wave from the 1.3357 low to 1.3502 high.
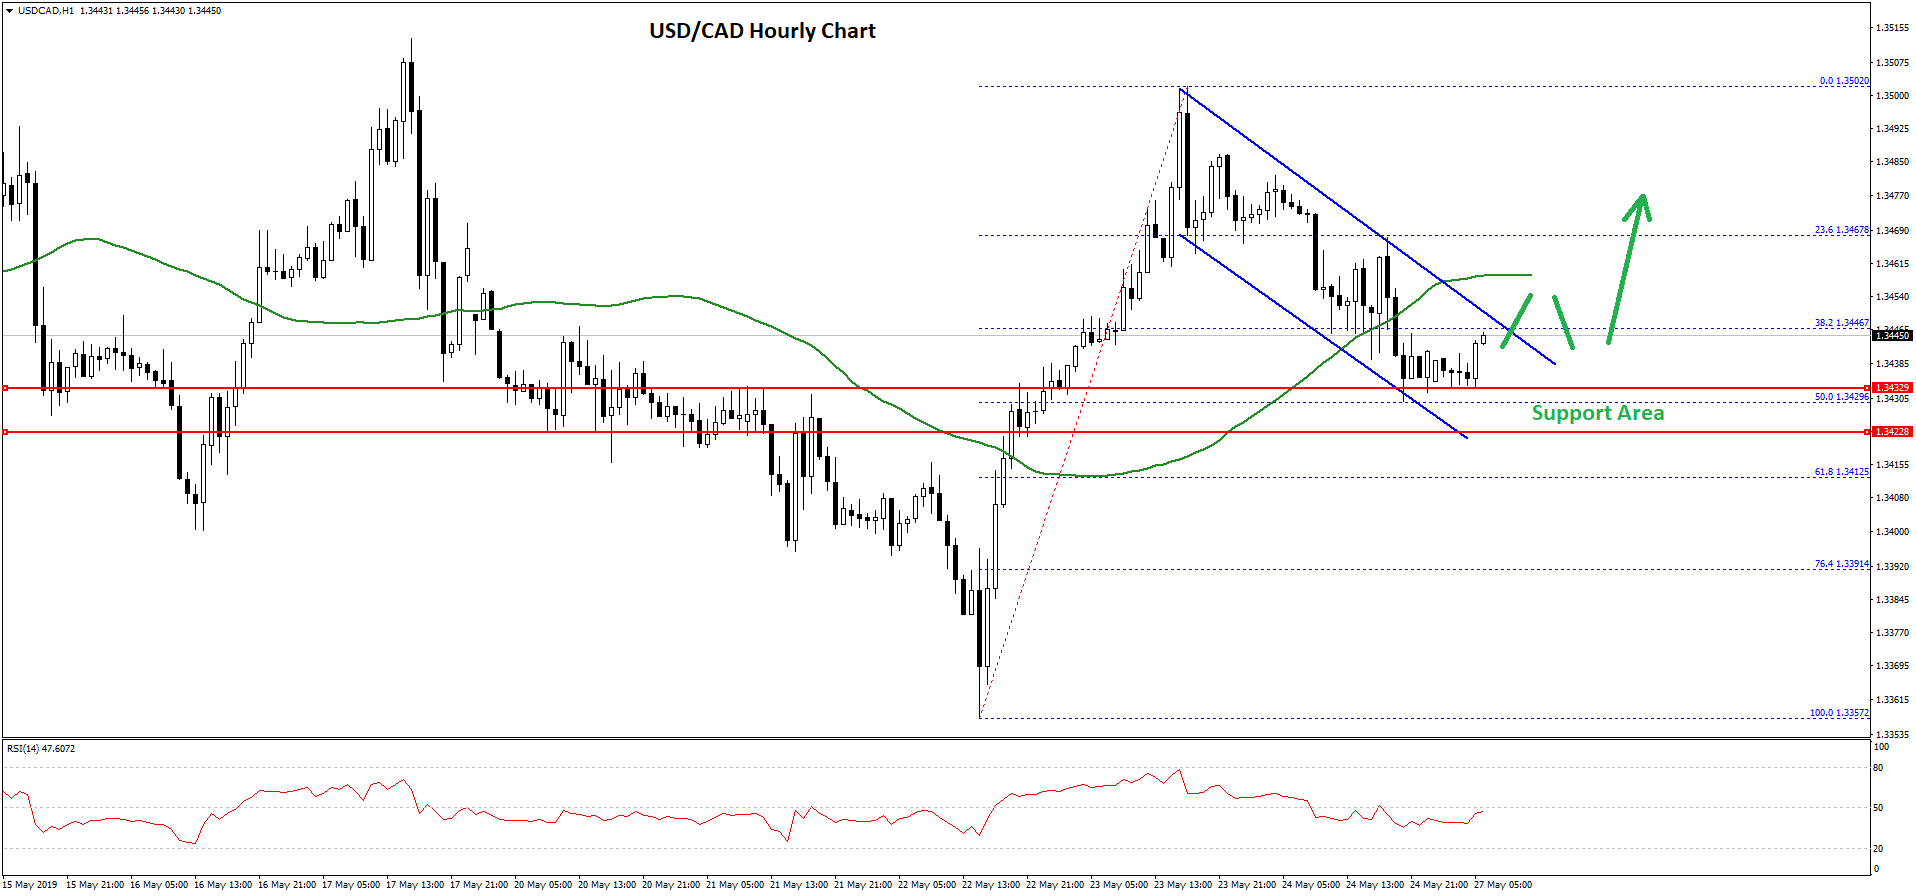
However, the decline was protected by the key 1.3430 support area. Moreover, the 50% Fib retracement level of the last wave from the 1.3357 low to 1.3502 high is also acting as a strong support near the 1.3429 level.
At the outset, the pair is currently following a bullish flag pattern with resistance near 1.3450 on the hourly chart. A clear break above the flag resistance at 1.3450 is likely to open the doors for a fresh increase above the 1.3460 and 1.3480 levels.
The main resistance on the upside is near the 1.3500 level, above which the pair could test the 1.3525 level. Conversely, if there is a downside break below the 1.3430 or 1.3420 support, USD/CAD might decline further. The next key support is at 1.3400, where the bulls are likely to appear.
Trade over 50 forex markets 24 hours a day with FXOpen. Take advantage of low commissions, deep liquidity, and spreads from 0.0 pips. Open your FXOpen account now or learn more about trading forex with FXOpen.
This article represents the opinion of the Companies operating under the FXOpen brand only. It is not to be construed as an offer, solicitation, or recommendation with respect to products and services provided by the Companies operating under the FXOpen brand, nor is it to be considered financial advice.
Latest from Forex Analysis
Latest articles

AUD/USD Rises Sharply on Inflation News
The Consumer Price Index for Australia was released this morning. According to ForexFactory:
→ CPI in quarterly terms: actual = 1.0%, expected = 0.8%, previous value = 0.6%;
→ CPI in annual terms: actual = 3.5%, expected = 3.4%, previous value = 3.

TSLA Share Price Up About 13% Despite Disappointing Report
Yesterday, TSLA trading closed at USD 144.68 per share, after which Tesla reported its results for the 1st quarter:
→ earnings per share: actual = USD 0.45, forecast = USD 0.49;
→ gross income: actual = USD 21.45 billion, forecast = USD

Market Analysis: Gold Price Corrects Gains While Oil Price Regains Strength
Gold price rallied above $2,400 before correcting lower. Crude oil price is rising and it could climb further higher toward the $85.50 resistance.
Important Takeaways for Gold and Oil Prices Analysis Today
· Gold price rallied significantly above $2,