


FXOpen

GBP/USD started a fresh decline after it failed to clear the 1.3700 resistance. USD/CAD is rising and it is currently eyeing an upside break above 1.2750.
Important Takeaways for GBP/USD and USD/CAD
- The British Pound started a major downside correction from well above 1.3650.
- There is a major bearish trend line forming with resistance near 1.3610 on the hourly chart of GBP/USD.
- USD/CAD started a fresh increase after forming a support base near the 1.2660 level.
- There was a break above a key bearish trend line with resistance at 1.2700 on the hourly chart.
GBP/USD Technical Analysis
After a decent increase, the British Pound faced resistance near 1.3680-1.3700 against the US Dollar. As a result, the GBP/USD pair started a fresh decline and broke a couple of important supports near 1.3650.
The pair gained bearish momentum below the 1.3600 level and the 50 hourly simple moving average. It even broke a major support zone at 1.3540 to move into a bearish zone. It traded as low as 1.3496 on FXOpen, and the pair is currently consolidating losses.
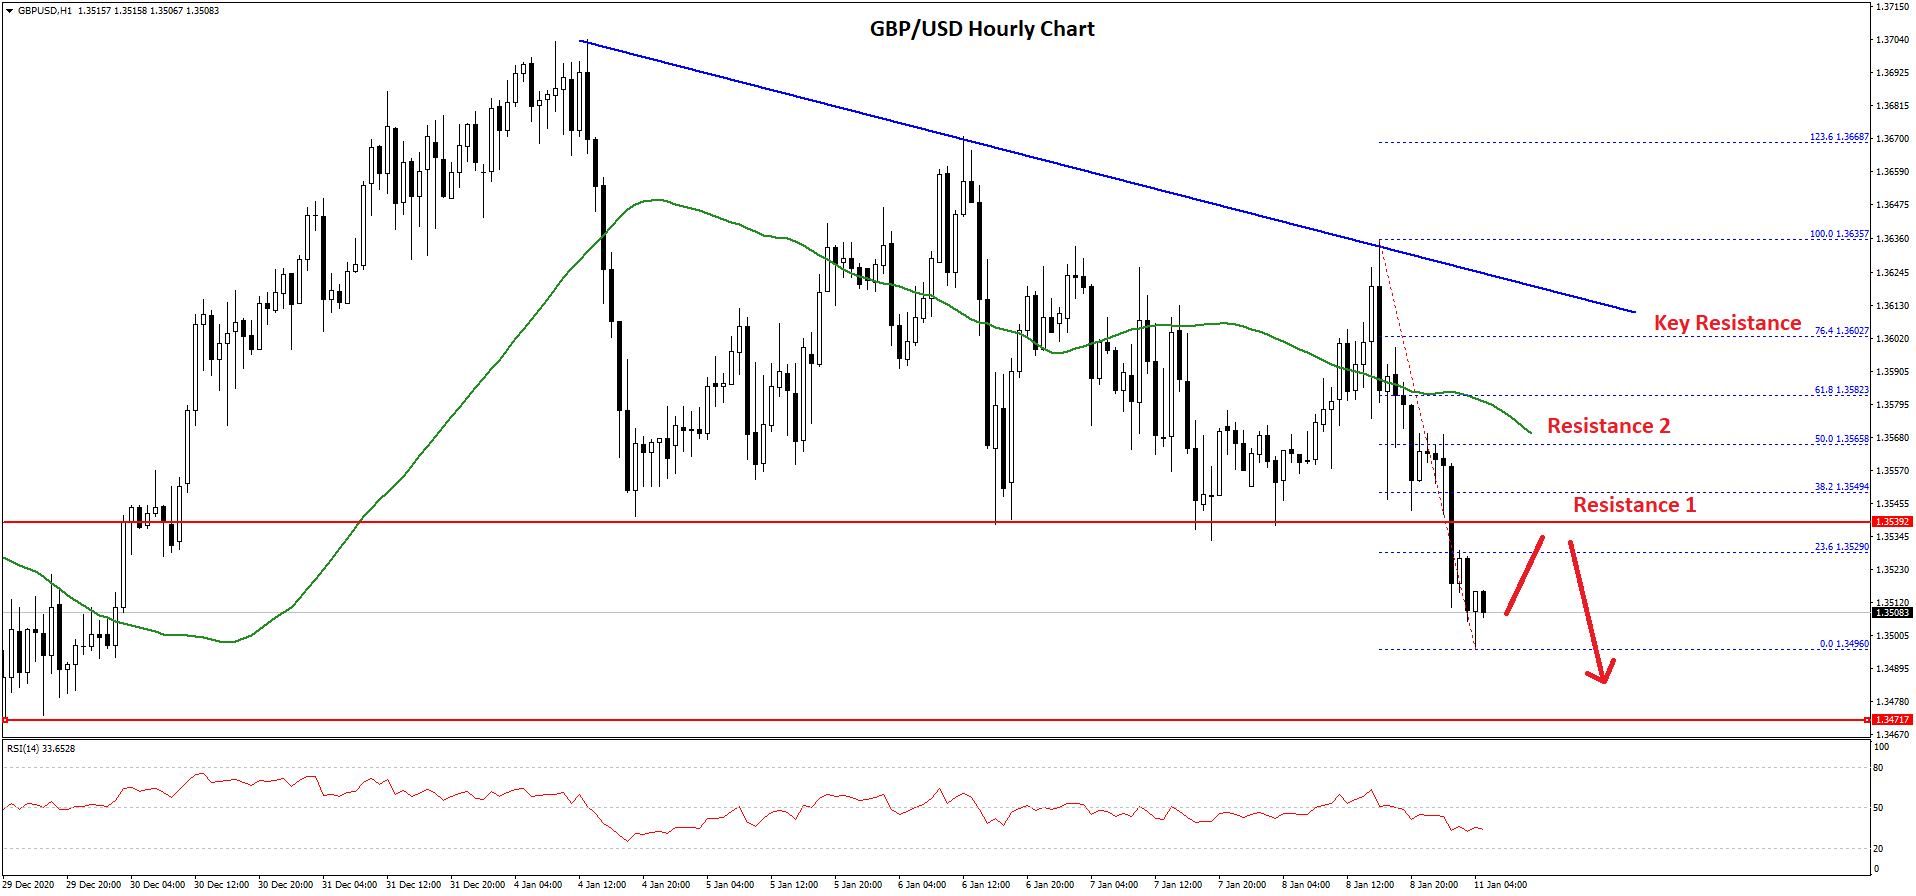
An initial resistance on the upside is near the 1.3525 level. It is close to the 23.6% Fib retracement level of the recent decline from the 1.3635 high to 1.3496 low.
The first major resistance is near the 1.3540 level (the recent breakdown zone). The next resistance is near the 1.3565 zone and the 50 hourly simple moving average. It is also close to the 50% Fib retracement level of the recent decline from the 1.3635 high to 1.3496 low.
Finally, there is a major bearish trend line forming with resistance near 1.3610 on the hourly chart of GBP/USD. Clearly, the pair is likely to face many hurdles if it starts an upside correction from the recent low of 1.3496.
On the downside, the first key support is near the 1.2500 area. The next major support is near the 1.3470 level, below which there is a risk of a sharp decline.
USD/CAD Technical Analysis
The US Dollar traded as low as 1.3629 before starting a decent upward move against the Canadian Dollar. The USD/CAD pair broke the 1.3650 and 1.3665 resistance levels to move into a short-term bullish zone.
The pair gained pace above the 1.3700 level and the 50 hourly simple moving average. Moreover, there was a break above a key bearish trend line with resistance at 1.2700 on the hourly chart.
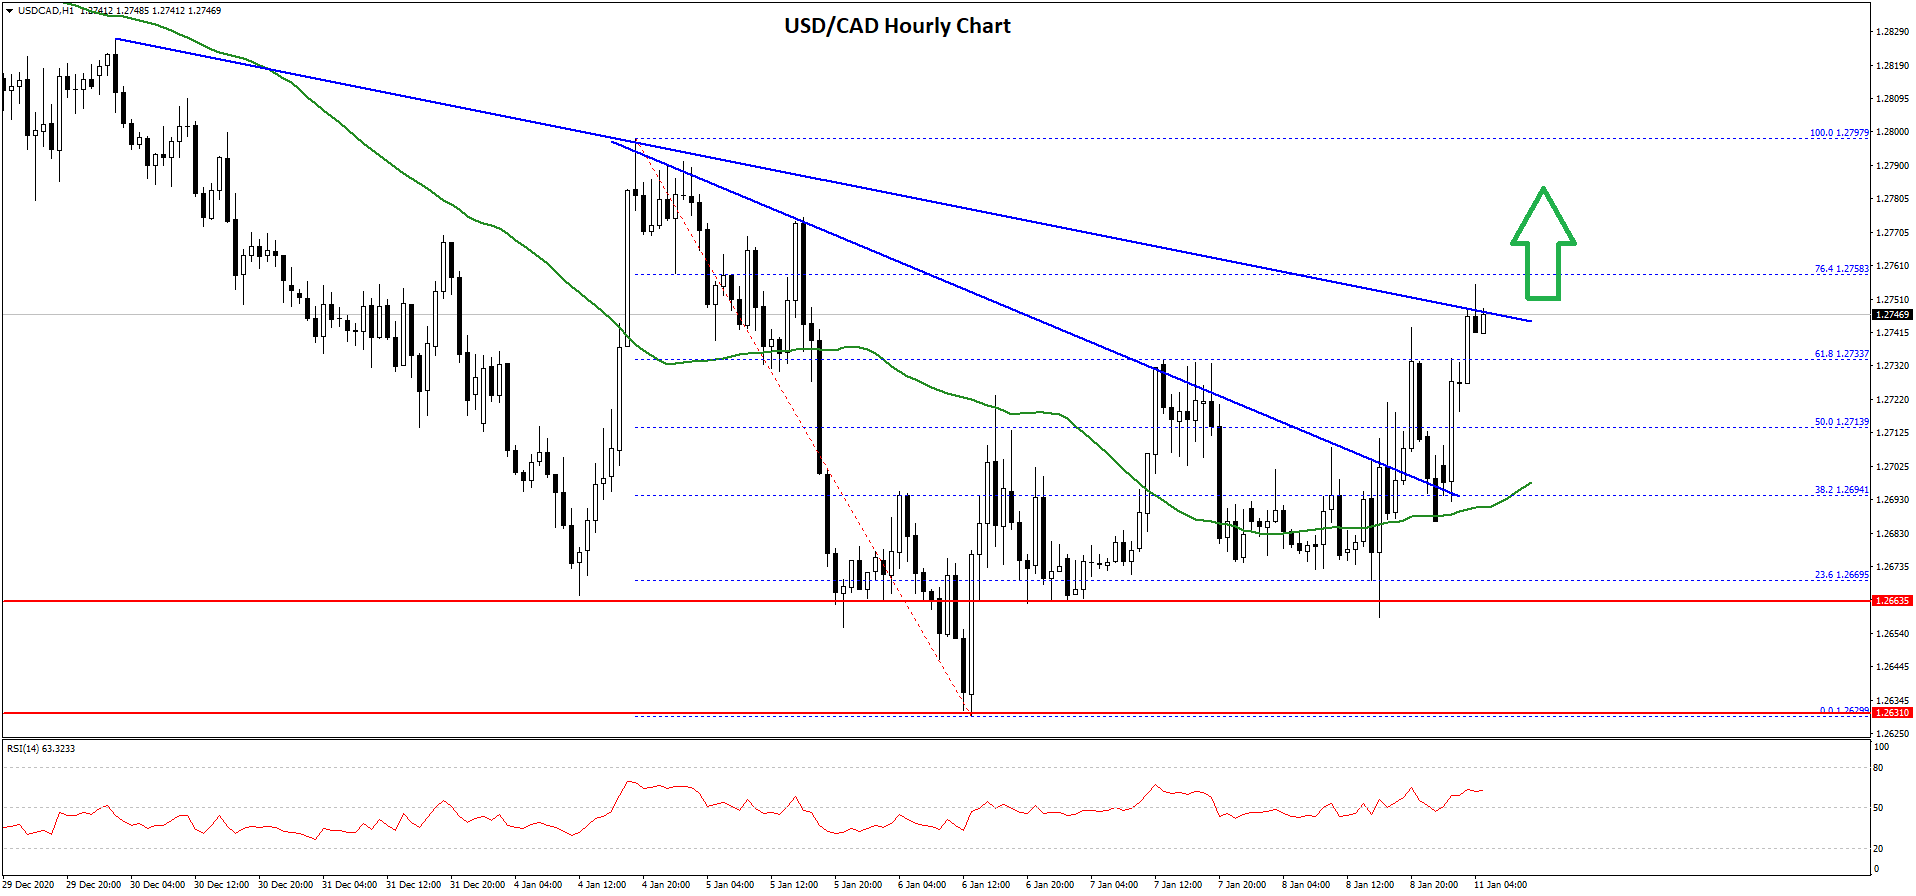
The pair even broke 1.2720, and climbed above the 50% Fib retracement level of the downward move from the 1.2797 high to 1.2629 swing low. It is now attempting an upside break above another bearish trend line with resistance at 1.2750 on the same chart.
The next key resistance is near the 1.2760 level. It is close to the 76.4% Fib retracement level of the downward move from the 1.2797 high to 1.2629 swing low.
A clear break above the 1.2750 and 1.2760 resistance levels may possibly increase the chances of a strong upward move in the coming sessions. The next key resistance sits at 1.2800.
Conversely, USD/CAD might start another decline if it fails near 1.2750. An initial support is near the 1.2700 level and the 50 hourly SMA. The main support seems to be forming near 1.2665.
Trade over 50 forex markets 24 hours a day with FXOpen. Take advantage of low commissions, deep liquidity, and spreads from 0.0 pips. Open your FXOpen account now or learn more about trading forex with FXOpen.
This article represents the opinion of the Companies operating under the FXOpen brand only. It is not to be construed as an offer, solicitation, or recommendation with respect to products and services provided by the Companies operating under the FXOpen brand, nor is it to be considered financial advice.
Latest from Forex Analysis
Latest articles

What Is the VIX Index, and How Is It Used in Trading?
The VIX Index serves as a key indicator of expected market volatility over the next 30 days, derived directly from S&P 500 options. Developed by the Chicago Board Options Exchange in 1993, it offers a simple way to

The Stock Price of PepsiСo (PEP) Is Retracting from Its Yearly High
On April 23, the quarterly report of PepsiCo's performance for the first quarter was published, which was awaited anxiously.
The issue stemmed from the fact that in December 2023, the U.S. Food and Drug Administration (FDA) announced the recall

The S&P 500 Index Has Reached a Significant Resistance Level
Analyzing the S&P 500 chart (US SPX 500 mini on FXOpen) on April 26, we wrote about how the April decline could be a correction to the lower boundary of the channel within the 2024 rally. Following this,