


FXOpen

GBP/USD started a decent increase and climbed above the 1.2450 resistance. Conversely, GBP/JPY is currently correcting lower and it could decline towards 134.00.
Important Takeaways for GBP/USD and GBP/JPY
- The British Pound is currently consolidating gains above the 1.2450 support.
- There is a key connecting bullish trend line forming with support near 1.2420 on the hourly chart of GBP/USD.
- GBP/JPY is currently showing a few bearish signs below the 135.50 support.
- There was a break below a major bullish trend line with support at 135.25 on the hourly chart.
GBP/USD Technical Analysis
This past week, the British Pound started a steady rise from the 1.2250 support area against the US Dollar. The GBP/USD pair broke a few important hurdles near the 1.2350 level to move into a positive zone.
Moreover, the pair traded above the 1.2400 resistance area and the 50 hourly simple moving average. It even surged above the 1.2450 resistance and traded as high as 1.2486 on FXOpen.
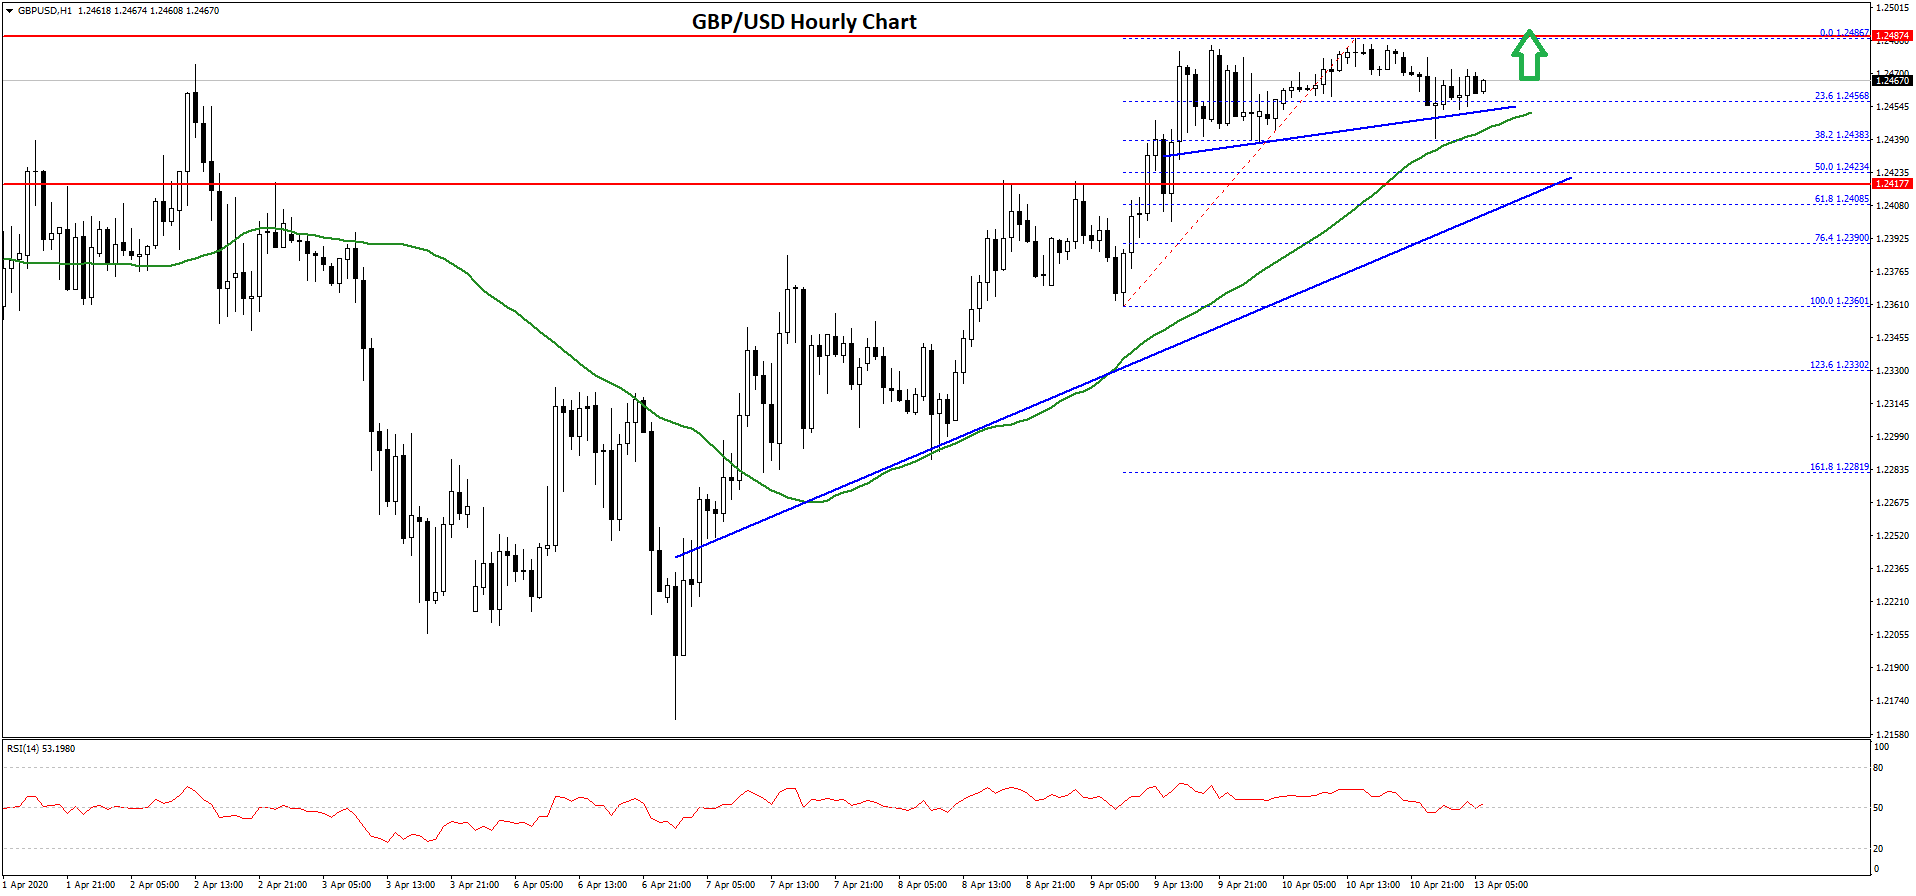
Recently, there was a minor downside correction from the 1.2486 high. The pair traded below the 23.6% Fib retracement level of the upward move from the 1.2360 low to 1.2486 high.
However, the pair remained well bid above the 1.2440 level and the 50 hourly simple moving average. There is also a key connecting bullish trend line forming with support near 1.2420 on the hourly chart of GBP/USD.
The 50% Fib retracement level of the upward move from the 1.2360 low to 1.2486 high is also close to the trend line support. Therefore, the bulls are likely to protect the 1.2420 and 1.2440 support levels.
Any further losses may perhaps lead the pair towards the 1.2350 support area. Conversely, it could continue to rise above the 1.2480 level. The first key resistance is near the 1.2500 area, above which the pair could surge towards the 1.2560 and 1.2580 levels in the near term.
GBP/JPY Technical Analysis
The British Pound also followed a bullish path and traded above the 134.50 resistance against the Japanese Yen. The GBP/JPY pair even traded above the 135.50 level before the bears appeared.
It traded as high as 135.74 and recently started a downside correction. There was a break below the 135.50 support and the 50 hourly simple moving average.
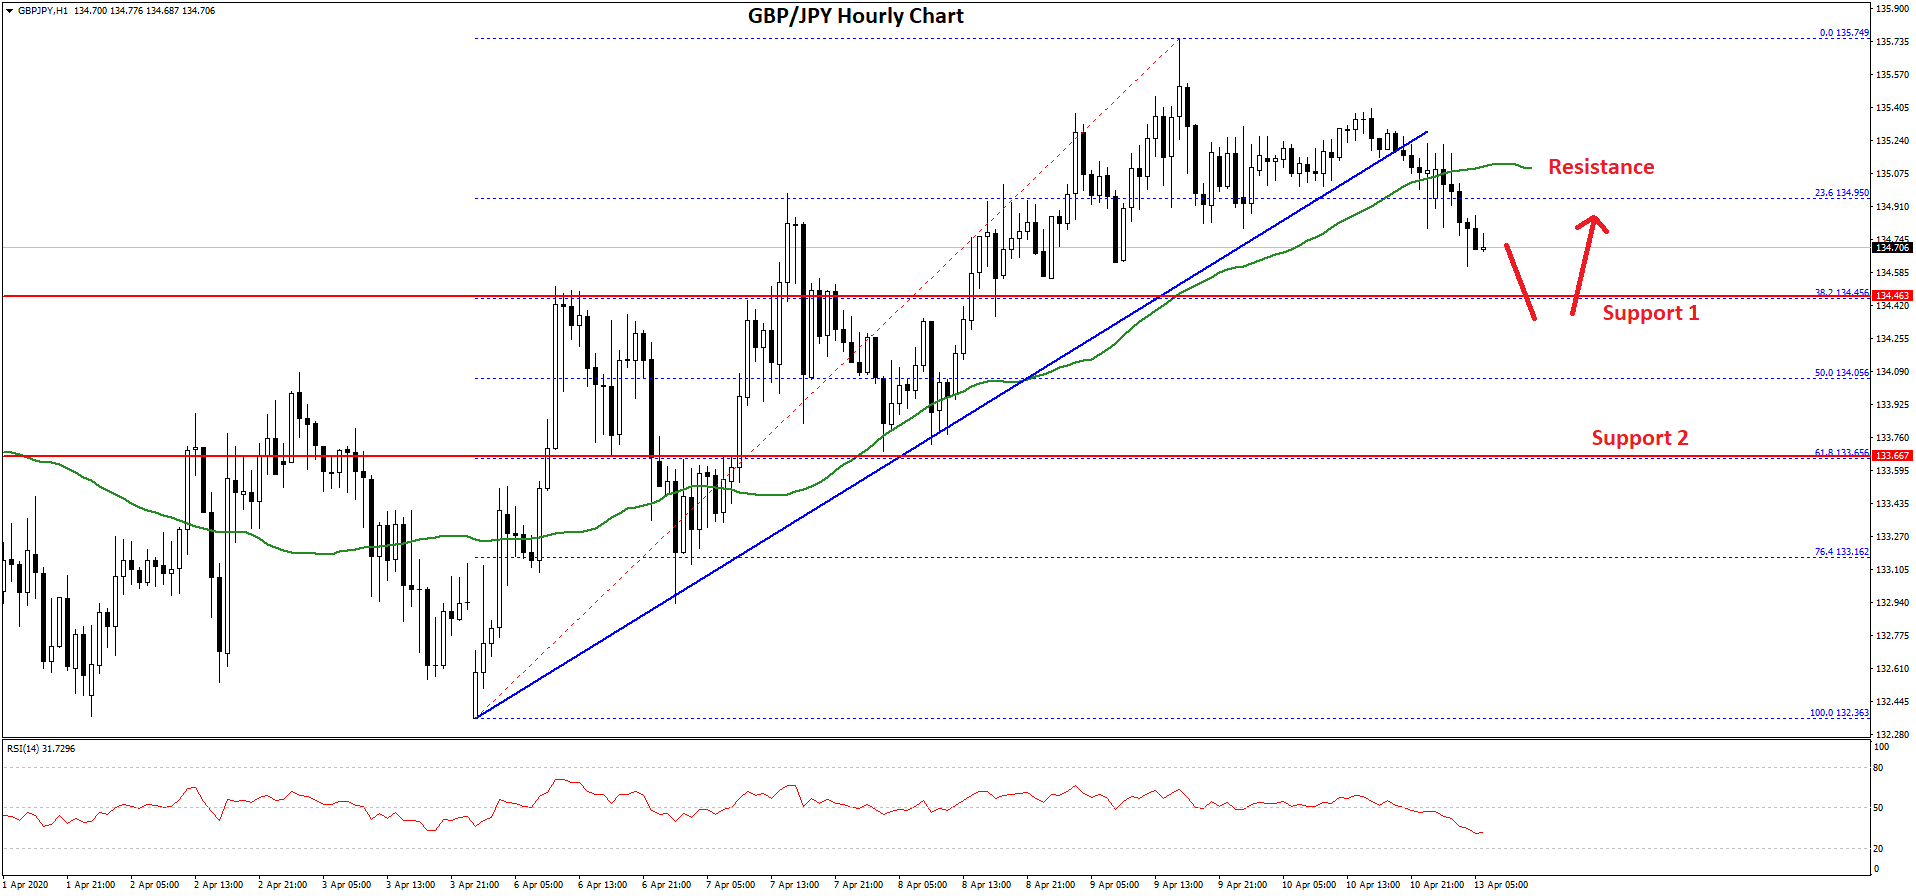
Besides, there was a break below a major bullish trend line with support at 135.25 on the hourly chart. The pair is now trading below the 23.6% Fib retracement level of the upward move from the 132.36 low to 135.74 high.
On the downside, an initial support is near the 134.50 and 134.40 levels. If there are more losses, the pair could decline towards the 134.00 support. It is close to the 50% Fib retracement level of the upward move from the 132.36 low to 135.74 high.
The main support is now near the 133.65 level. On the upside, the recent support near the 135.25 level and the 50 hourly SMA might act as a hurdle for the bulls.
To start a fresh increase, GBP/JPY must recover above 135.00 and settle nicely above the 50 hourly SMA. The next key resistance is near 135.75, above which the pair might test 136.20 in the near term.
Trade over 50 forex markets 24 hours a day with FXOpen. Take advantage of low commissions, deep liquidity, and spreads from 0.0 pips. Open your FXOpen account now or learn more about trading forex with FXOpen.
This article represents the opinion of the Companies operating under the FXOpen brand only. It is not to be construed as an offer, solicitation, or recommendation with respect to products and services provided by the Companies operating under the FXOpen brand, nor is it to be considered financial advice.
Latest from Forex Analysis
Latest articles

AUD/USD Rises Sharply on Inflation News
The Consumer Price Index for Australia was released this morning. According to ForexFactory:
→ CPI in quarterly terms: actual = 1.0%, expected = 0.8%, previous value = 0.6%;
→ CPI in annual terms: actual = 3.5%, expected = 3.4%, previous value = 3.

TSLA Share Price Up About 13% Despite Disappointing Report
Yesterday, TSLA trading closed at USD 144.68 per share, after which Tesla reported its results for the 1st quarter:
→ earnings per share: actual = USD 0.45, forecast = USD 0.49;
→ gross income: actual = USD 21.45 billion, forecast = USD

Market Analysis: Gold Price Corrects Gains While Oil Price Regains Strength
Gold price rallied above $2,400 before correcting lower. Crude oil price is rising and it could climb further higher toward the $85.50 resistance.
Important Takeaways for Gold and Oil Prices Analysis Today
· Gold price rallied significantly above $2,