


FXOpen
GBP/USD declined heavily below the 1.2920 and 1.2900 support levels. EUR/GBP rallied sharply and climbed above the 0.8500 resistance area.
Important Takeaways for GBP/USD and EUR/GBP
- The British Pound started a major decline after it failed to surpass the 1.3000 resistance area.
- There is a key bearish trend line forming with resistance near 1.2860 on the hourly chart of GBP/USD.
- EUR/GBP surged higher after forming a bottoming pattern near the 0.8360 level.
- There is a major bullish trend line forming with support near 0.8585 on the hourly chart.
GBP/USD Technical Analysis
This past week, the British Pound struggled to gain bullish momentum above the 1.3000 resistance against the US Dollar. As a result, the GBP/USD pair started a major decline below the 1.2950 and 1.2920 levels.
Moreover, there was a break below the 1.2860 support level and the 50 hourly simple moving average. Finally, the pair declined below the 1.2800 area and traded as low as 1.2725 on FXOpen.
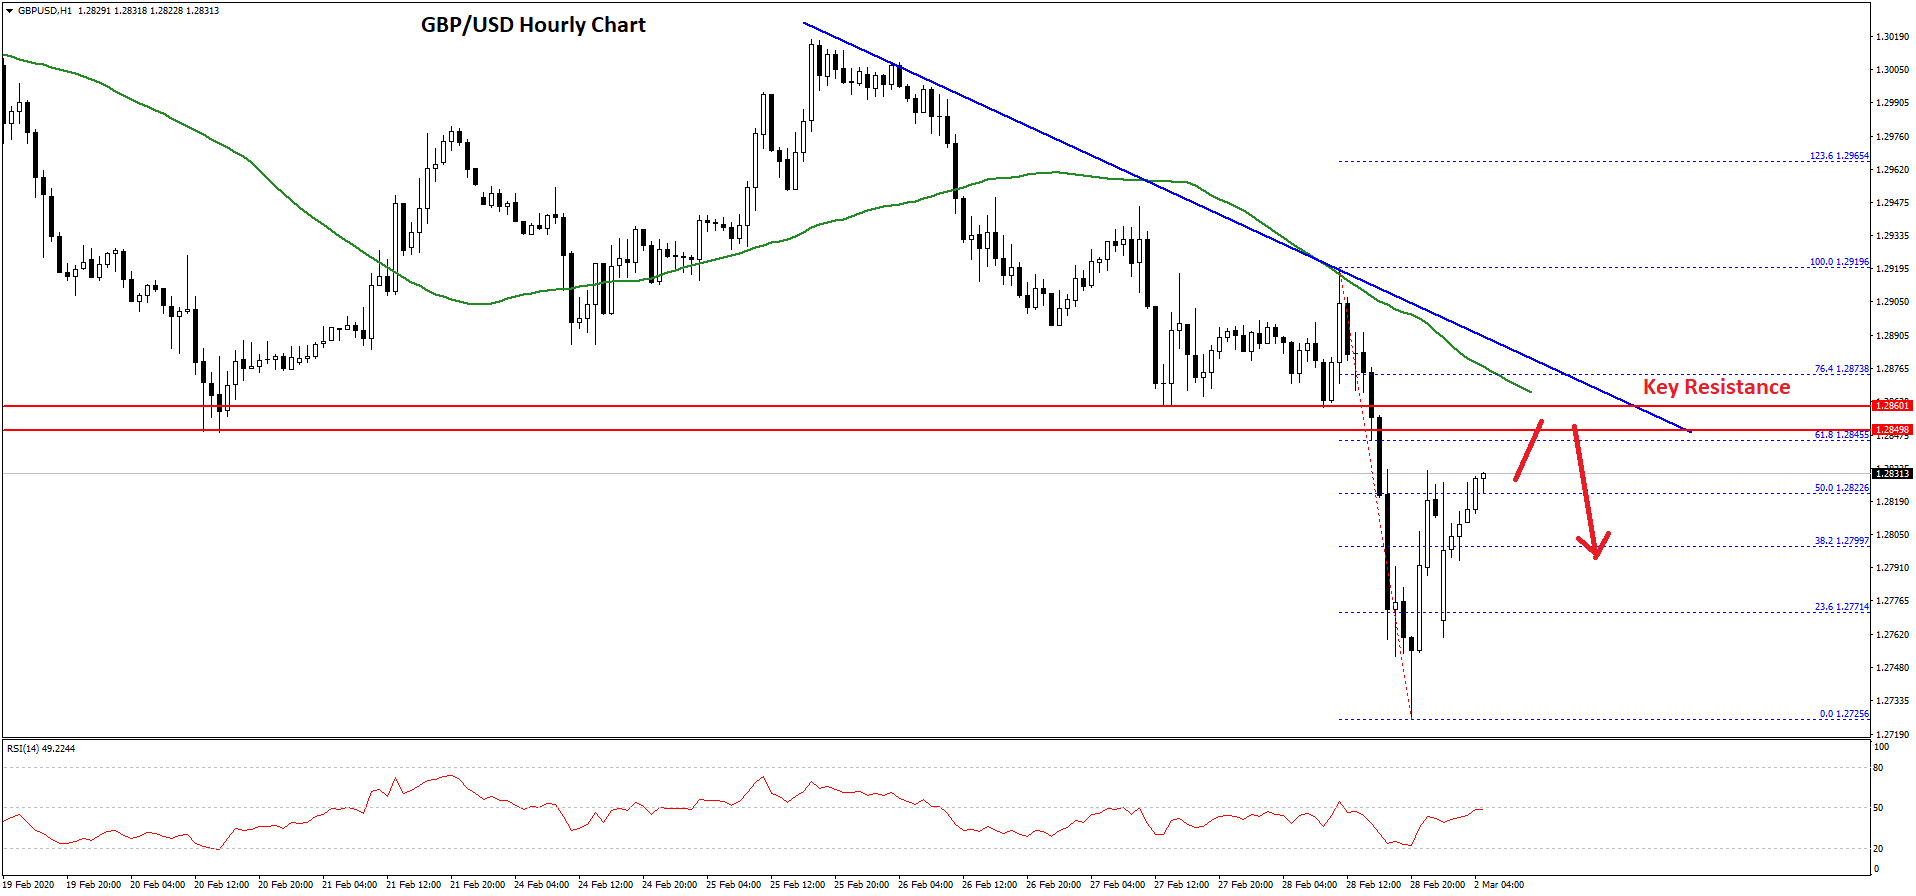
It is currently correcting higher above the 1.2780 and 1.2800 levels. There was a break above the 50% Fib retracement level of the recent decline from the 1.2919 high to 1.2725 low.
However, there are a couple of important hurdles waiting on the upside near the 1.2860 level (the previous key support). Moreover, there is a key bearish trend line forming with resistance near 1.2860 on the hourly chart of GBP/USD.
The trend line is close to the 61.8% Fib retracement level of the recent decline from the 1.2919 high to 1.2725 low. The 50 hourly simple moving average is also near the 1.2860 resistance area.
Therefore, the GBP/USD might struggle to continue higher above the 1.2860 and 1.2880 resistance levels. If the pair succeeds in gaining pace above the 1.2860 area, it could start a strong increase. The next major resistance is seen near the 1.2950 level.
Conversely, there is a risk of more losses below the 1.2800 support area. The next key support is near the 1.2750 level, below which it could retest the 1.2725 low.
EUR/GBP Technical Analysis
The Euro started a solid upward move after forming a bottoming pattern near the 0.8360 level against the British Pound. As a result, the EUR/GBP pair broke many important resistances near the 0.8450 and 0.8500 level.
The pair even settled above the 0.8550 level and the 50 hourly simple moving average. The upward move was such that the pair spiked above 0.8600 and traded as high as 0.8649.
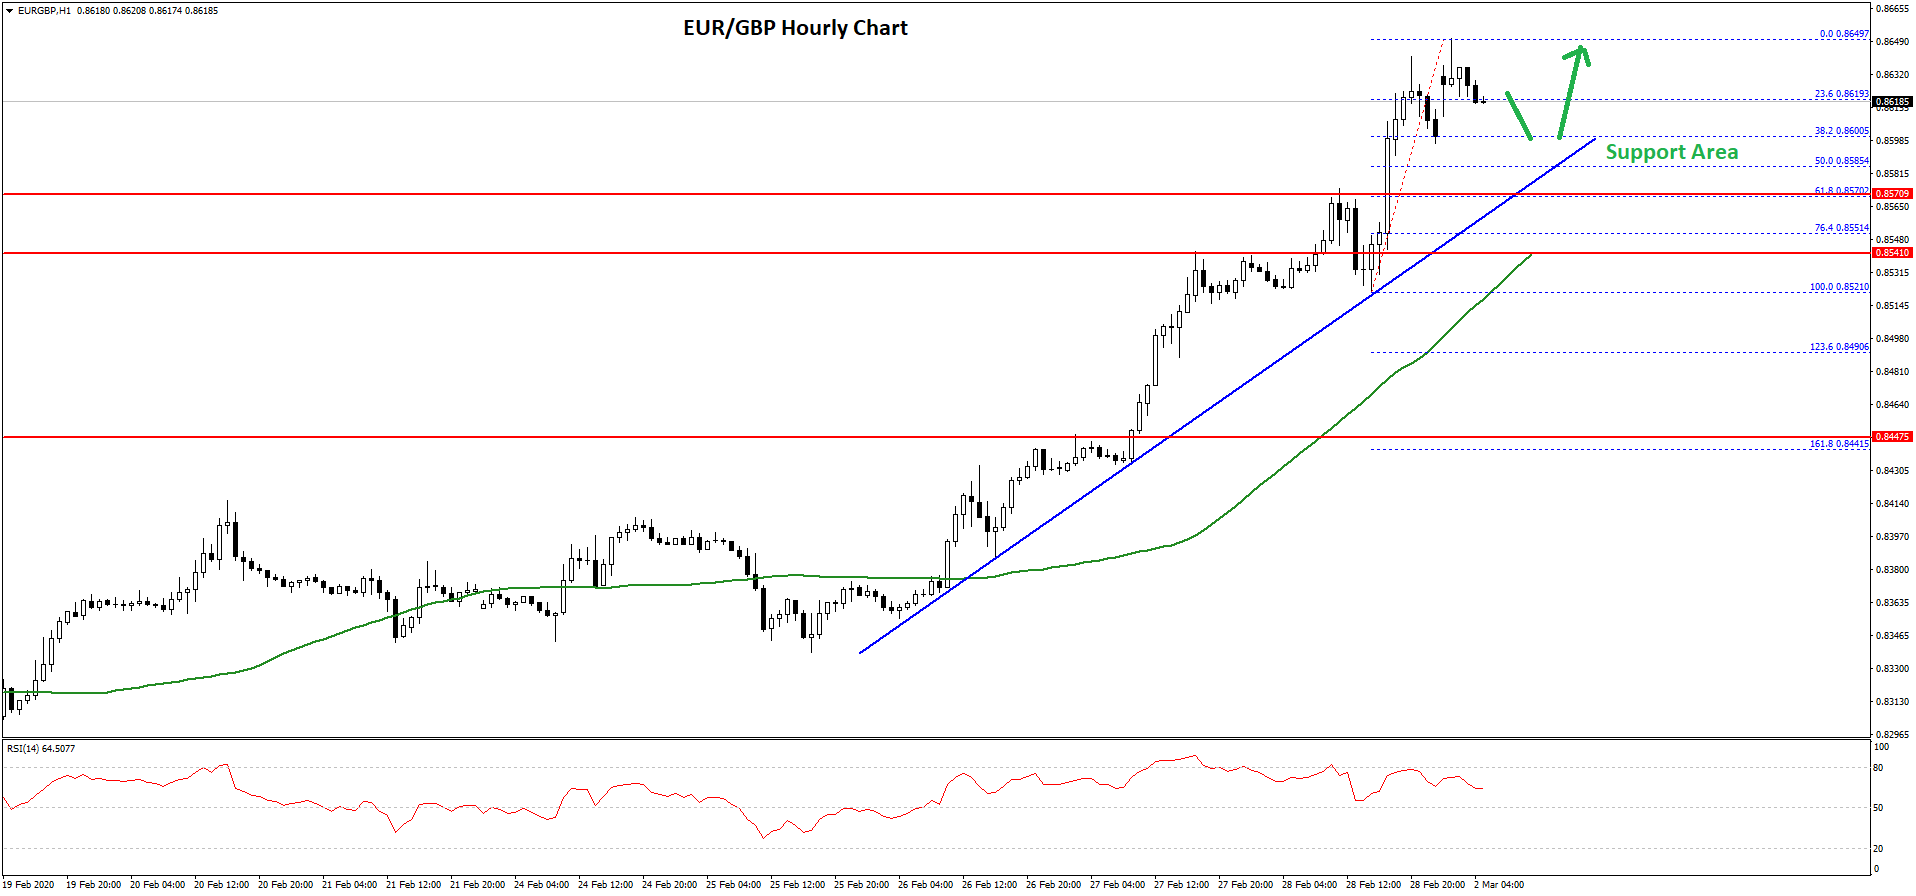
It is currently correcting lower and trading below the 0.8630 level. There was a break below the 23.6% Fib retracement level of the upward move from the 0.8521 low to 0.8649 high.
However, there are many key supports on the downside near the 0.8585 level. There is also a major bullish trend line forming with support near 0.8585 on the hourly chart.
The trend line is close to the 50% Fib retracement level of the upward move from the 0.8521 low to 0.8649 high. Below the trend line support, the next major support is near the 0.8540 level and the 50 hourly SMA.
Therefore, dips in EUR/GBP remain supported near 0.8550 and 0.8540 in the near term. On the upside, a break above the 0.8650 level could lead the pair towards the 0.8700 level.
Trade over 50 forex markets 24 hours a day with FXOpen. Take advantage of low commissions, deep liquidity, and spreads from 0.0 pips. Open your FXOpen account now or learn more about trading forex with FXOpen.
This article represents the opinion of the Companies operating under the FXOpen brand only. It is not to be construed as an offer, solicitation, or recommendation with respect to products and services provided by the Companies operating under the FXOpen brand, nor is it to be considered financial advice.
Latest from Forex Analysis
Latest articles

AUD/USD Rises Sharply on Inflation News
The Consumer Price Index for Australia was released this morning. According to ForexFactory:
→ CPI in quarterly terms: actual = 1.0%, expected = 0.8%, previous value = 0.6%;
→ CPI in annual terms: actual = 3.5%, expected = 3.4%, previous value = 3.

TSLA Share Price Up About 13% Despite Disappointing Report
Yesterday, TSLA trading closed at USD 144.68 per share, after which Tesla reported its results for the 1st quarter:
→ earnings per share: actual = USD 0.45, forecast = USD 0.49;
→ gross income: actual = USD 21.45 billion, forecast = USD

Market Analysis: Gold Price Corrects Gains While Oil Price Regains Strength
Gold price rallied above $2,400 before correcting lower. Crude oil price is rising and it could climb further higher toward the $85.50 resistance.
Important Takeaways for Gold and Oil Prices Analysis Today
· Gold price rallied significantly above $2,