


FXOpen
GBP/USD recovered nicely and moved back above 1.2900. USD/CAD is currently showing negative signs and it could decline further towards 1.3050.
Important Takeaways for GBP/USD and USD/CAD
- The British Pound formed a solid support near 1.2710 and recovered nicely.
- There is a steep bullish trend line formed with support at 1.2955 on the hourly chart of GBP/USD.
- USD/CAD declined recently and broke a bullish trend line at 1.3120 on the hourly chart.
- The pair could continue to move down as long as there is no close above 1.3135.
GBP/USD Technical Analysis
After heavy declines, the British Pound found support near the 1.2700-1.2710 zone against the US Dollar. The GBP/USD pair started a fresh upward move and traded above the 1.2750, 1.2800 and 1.2880 resistance levels.
The upward move was strong as the pair even settled above the 1.2900 level and the 50 hourly simple moving average. It traded close to the 1.3050 resistance and formed a high at 1.3040.
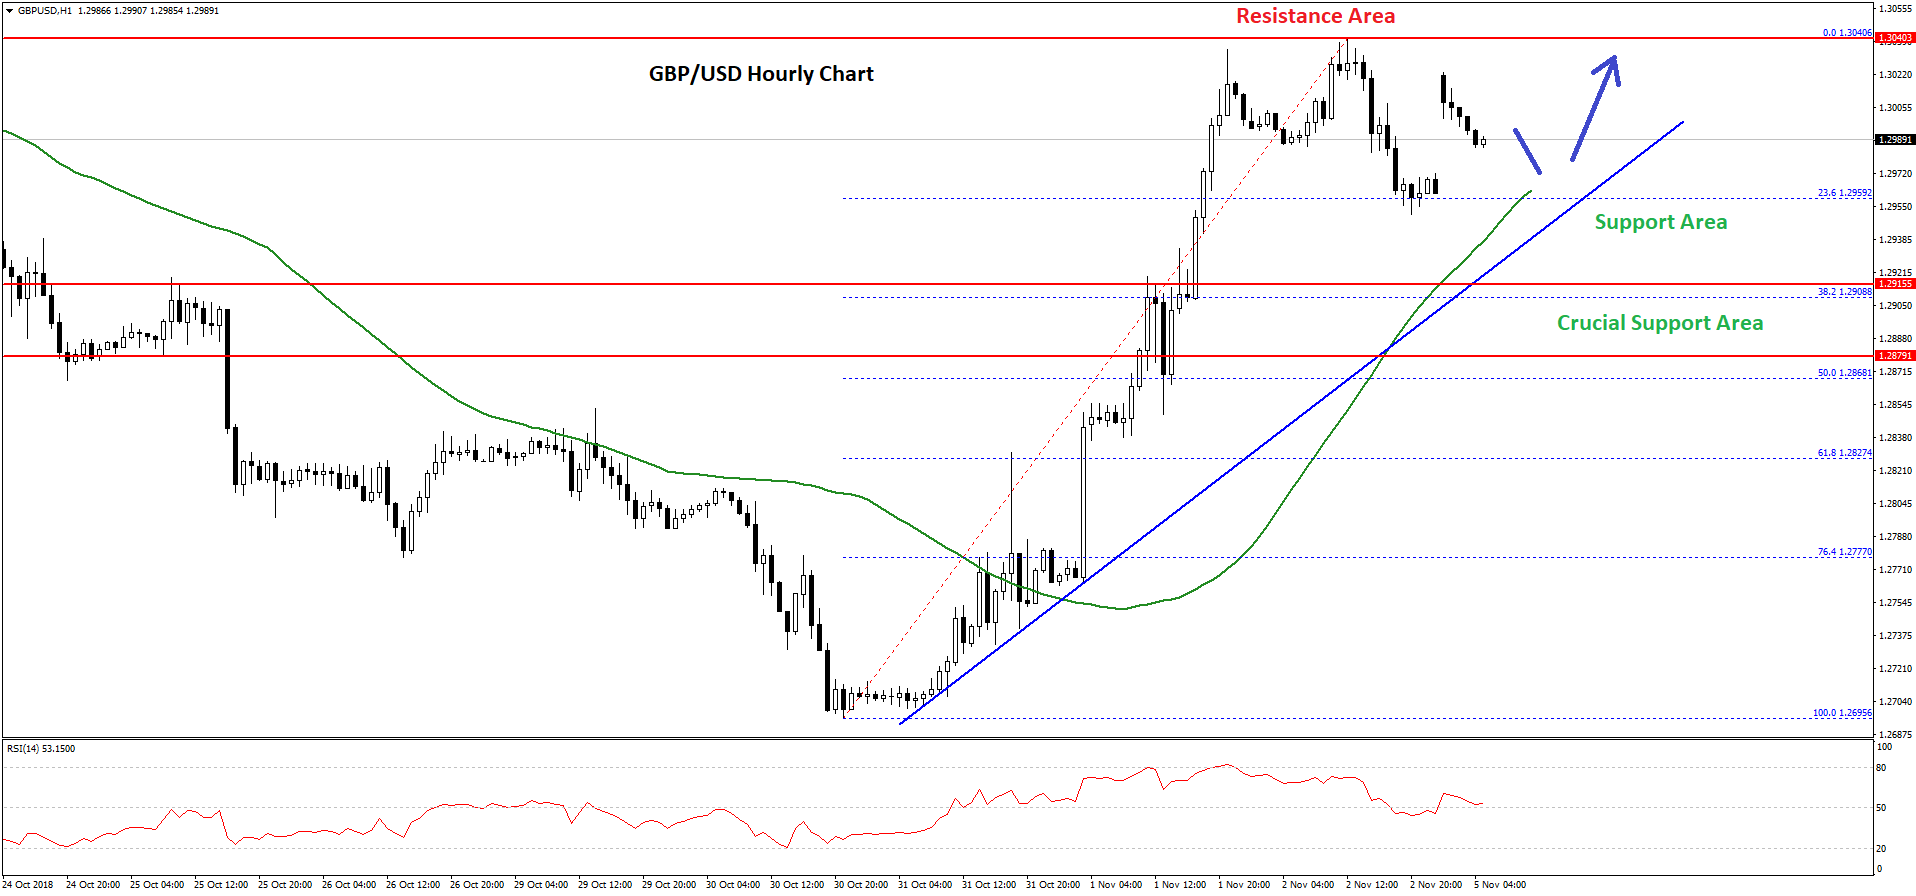
Later, the pair started a downside correction and traded below the 1.3000 level. It tested the 23.6% Fib retracement level of the recent wave from the 1.2695 low to 1.3040 high. On the downside, there are many supports near the 1.2950 level and the 50 hourly SMA.
Moreover, there is a steep bullish trend line formed with support at 1.2955 on the hourly chart. If there is a downside break below the trend line and the 50 SMA, the pair could correct sharply towards the 1.2880 zone.
The 50% Fib retracement level of the recent wave from the 1.2695 low to 1.3040 high is also around the 1.2870 level to act as a strong support.
Therefore, if the pair continues to correct lower, it could find support near the 1.2950 or 1.2880 level. On the upside, an initial resistance is at 1.3020, above which the pair could find resistance near 1.3040.
If there is a proper break above the 1.3040-1.3050 zone, the pair will most likely gain further towards the 1.3100 or 1.3120 level.
USD/CAD Technical Analysis
The US Dollar struggled to settle above the 1.3160-1.3170 zone against the Canadian Dollar. The USD/CAD pair started a downside correction and declined below the 1.3120 support recently.
During the recent decline, the pair even broke the 1.3100 support and the 50 hourly simple moving average. Moreover, there was a break below a bullish trend line at 1.3120 on the hourly chart.
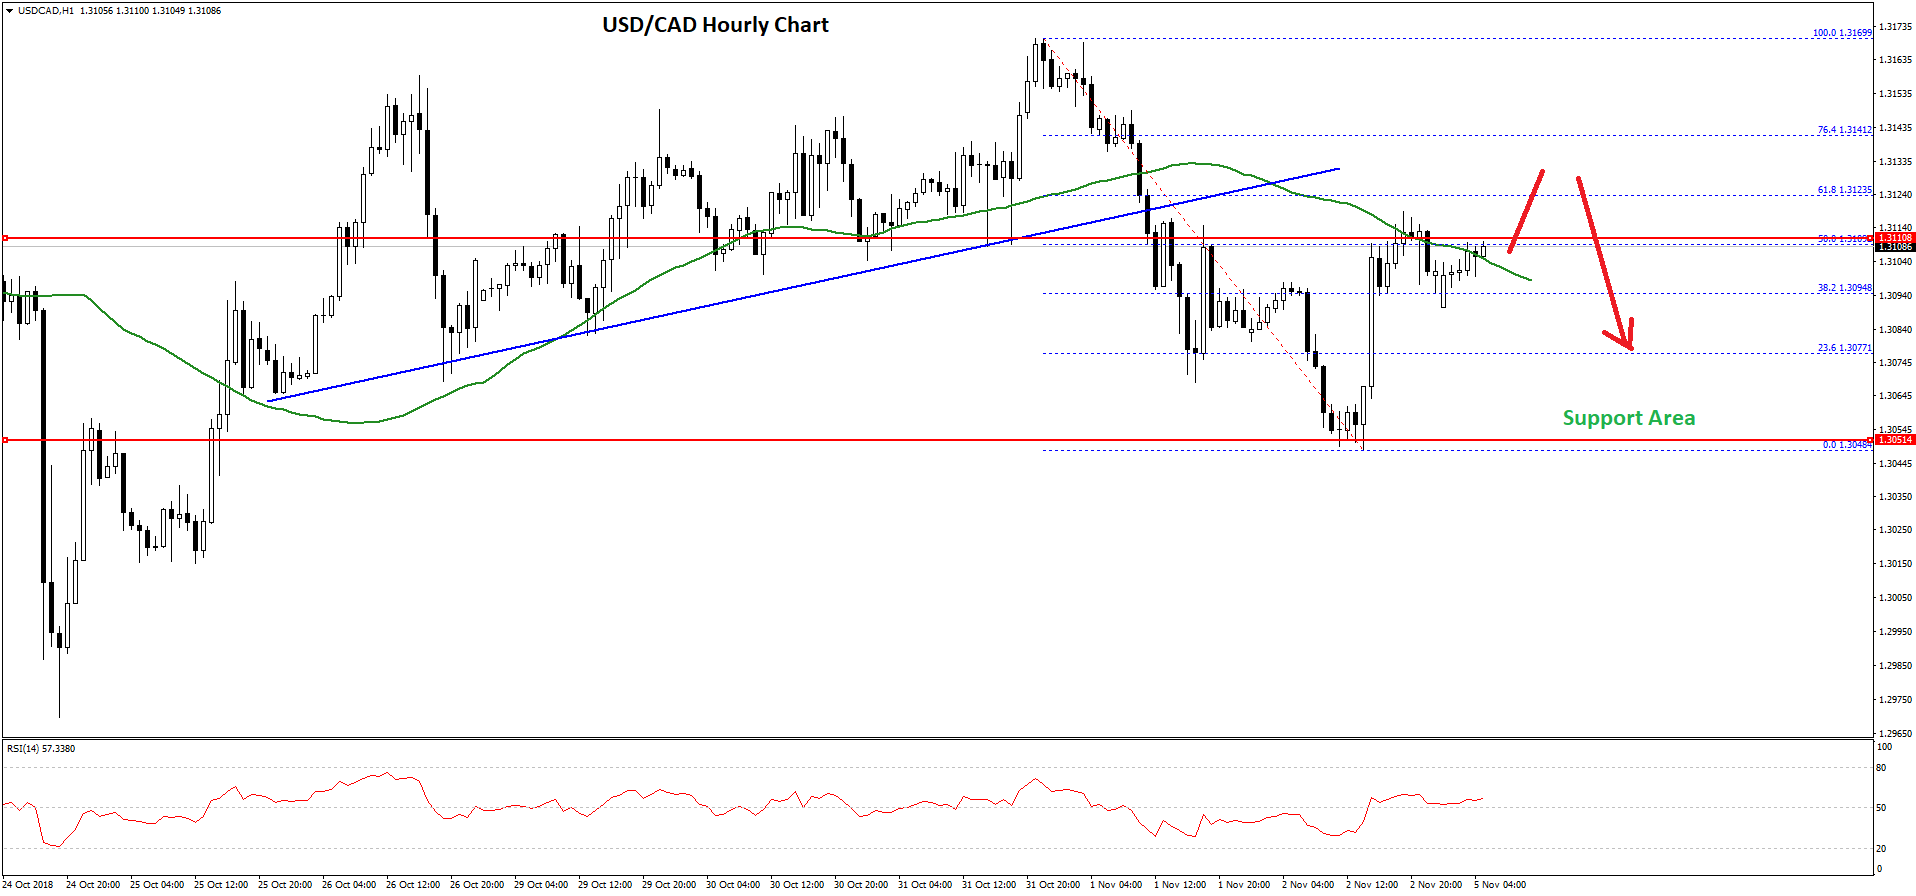
The pair traded as towards the 1.3050 support where buyers emerged. A low was formed at 1.3048 and later the pair started a recovery. It moved above the 23.6% Fib retracement level of the recent decline from the 1.3169 high to 1.3048 low.
However, buyers failed to surpass the 1.3120 zone and the 50% Fib retracement level of the recent decline from the 1.3169 high to 1.3048 low.
In the short term, there could be a spike above the 1.3120 resistance, but the pair is likely to struggle near the 1.3135 or 1.3140 level. If there is no break above 1.3140, the pair could decline once again towards the 1.3050 level.
On the other hand, if USD/CAD climbs above 1.3140, it may even break the 1.3160-1.3170 resistance zone to test the next hurdle near the 1.3200 zone.
Trade over 50 forex markets 24 hours a day with FXOpen. Take advantage of low commissions, deep liquidity, and spreads from 0.0 pips. Open your FXOpen account now or learn more about trading forex with FXOpen.
This article represents the opinion of the Companies operating under the FXOpen brand only. It is not to be construed as an offer, solicitation, or recommendation with respect to products and services provided by the Companies operating under the FXOpen brand, nor is it to be considered financial advice.
Latest from Forex Analysis
Latest articles

How to Identify and Trade Liquidity Grabs
Understanding the intricacies of market liquidity and the role of liquidity grabs can be crucial for optimising trading strategies. Liquidity grabs, creating rapid price movements, are a key component of Smart Money trading. This article explores how to identify these

What Is a Piercing Line Pattern, and How Can You Trade with It?
In the world of technical analysis, the piercing line pattern stands out as a solid indicator of potential market reversals. This article delves into the nuances of this two-candlestick pattern, exploring its formation, significance, and how traders can effectively leverage

London Calling! FTSE 100 Stocks Flying High Once Again
Back in 2021, which when looking at a physical calendar does not seem such a long time ago yet feels like an epoch ago when considering the changes in global economies and the capital markets since then, the FTSE 100